


11. 04. 2024
Business Service Monitoring, NetEye, SLM

Among others, the latest NetEye version comes up with several improvements in the fields of Discovery and Asset Management, as well as a new possibility to recognize patterns and trends within large datasets for a reliable Performance Management.
Additionally, the release of Alyvix 2.3 provides new features for End User Experience Monitoring, ready for being integrated to NetEye.
Recognition of patterns and trends within large datasets
A system monitoring has to fulfill the task of continuously checking for fault indications and status changes. Besides providing status notifications, lots of performance data are collected. Already in straightforward IT environments, the amount of data can be huge. If the databases where the collected data are stored (i.e. RRD), are not connected with each other, the evaluation is difficult and may result incomplete.
Through graphic data representation it was possible to somehow combine the different RRD data
bases. However, the comparison of many systems was rather difficult.
Timeoriented representation of performance data
With the new approach, which can be implemented from version NetEye 3.8, the barrier among different datasets is removed by storing the information in a homogenous time series database (TSDB). The benefit of this is, that a plurality of performance data from different systems for a certain time span can be graphically visualized and evaluated in a few moments.
The timeoriented representation of performance data is done by the database InfluxDB. Data can now be stored in NetEye with different resolutions and retention times.
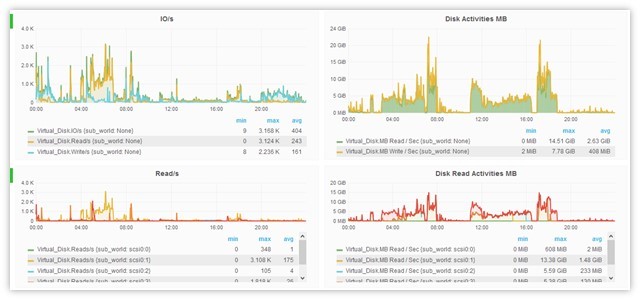
Visual comparison for trend recognition
Grafana provides the frontend for graphical representation. Through this frontend it is possible to define search queries and to generate the corresponding graphs.
The integration of InfluxDB and Grafana is designed for the recognition of trends within large datasets. The powerful database provides data within milliseconds after they are captured, whereby it provides the requirements for real time analysis. Patterns, trends, deviations and evolutions can be recognized through the comparison of historical data.
A typical application example of InfluxDB and Grafana is monitoring resource usage of different serverfarms. Performance data developments of different nodes can be compared and deviations from familiar patterns can be identified.
Upon customer request, InfluxDB and Grafana can be activated in NetEye 3.8.
Timesaving through extended infrastructure discovery
The basis of the NetEye discovery modul has been upgraded to NeDi 1.6.
Extension of the automatic discovery:
The automatic network discovery has been expanded and offers now better support of different manufacturers. The detection models for the discovery of the following components were improved:
• wireless access points and access point controller
• VMware based virtual infrastructures
• software-free devices as printers and switches
Representation of the network topology:
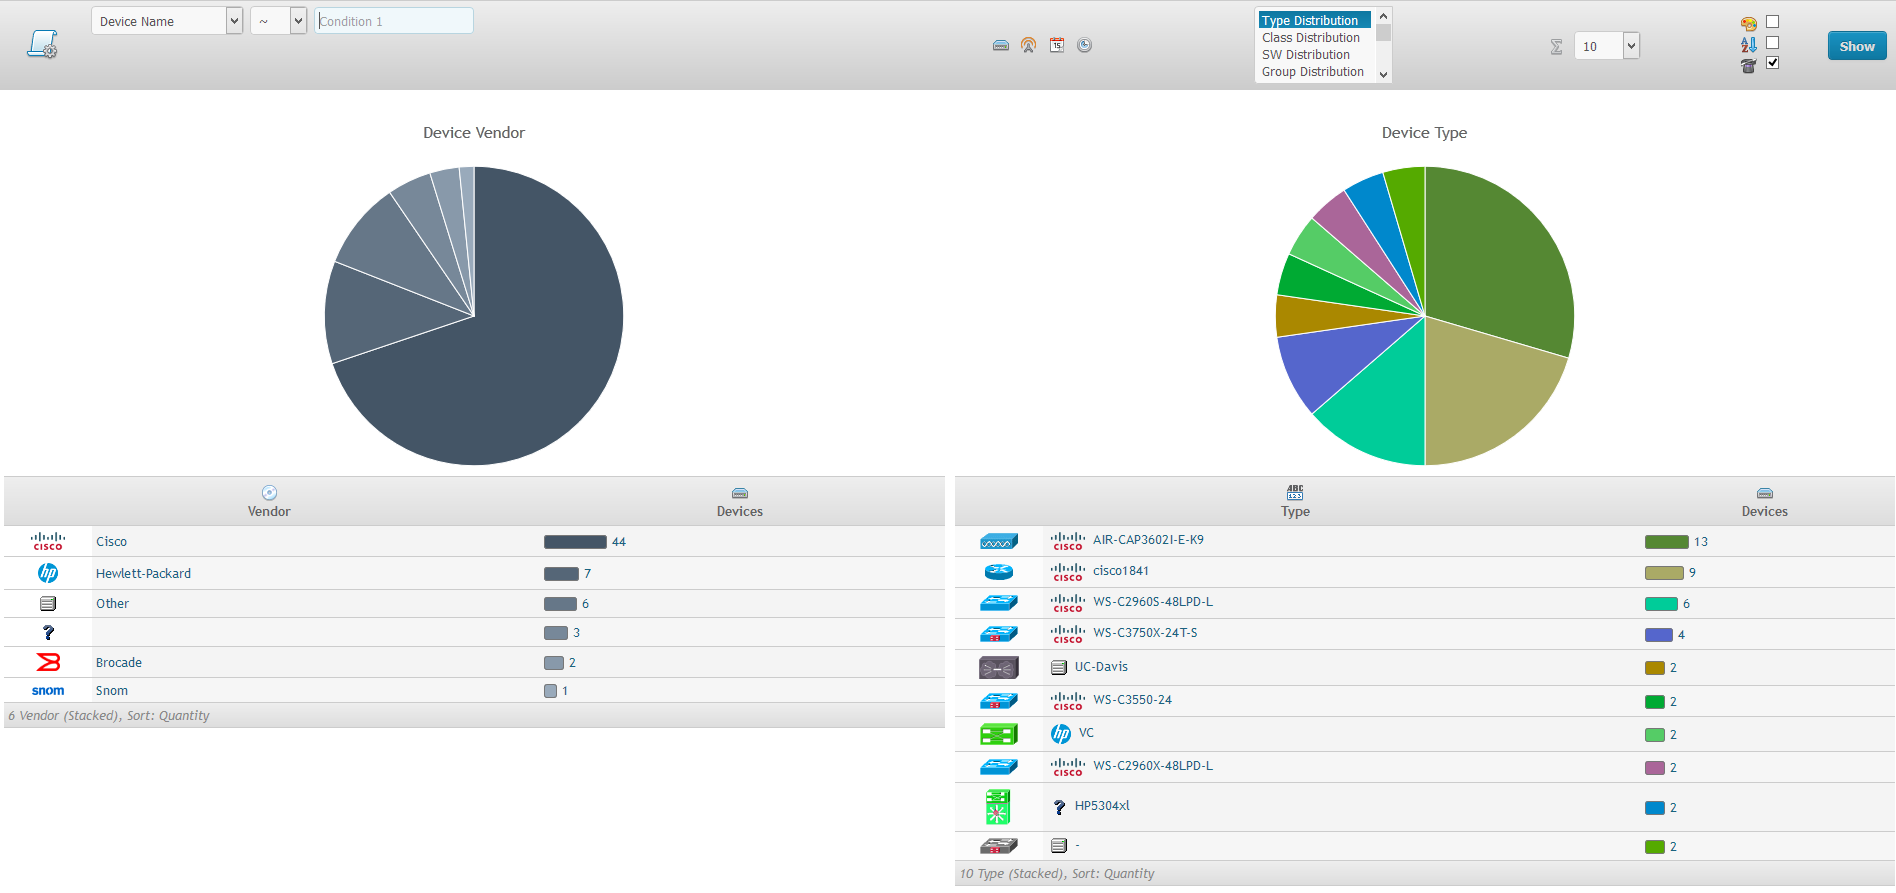
It is now possible to manually adapt the automatically generated graphs by zooming and dragging their elements. In this way, it is possible to get an even better overview of logical groupings and dependencies.
Besides the collection of device data as for example model, system, manufacturer etc., also summaries of the different categories are now automatically generated. This allows an intuitive overview of the network topology and its composition.
Password encryption for the command line
Through the upgrade to NeDi 1.6 access passwords for network devices can now be encrypted.
User friendly Asset Management
The upgrade of the underlying GLPI installation allows, through its vertical navigation bar, a quicker navigation to the desired contents. Also, plugins are now integrated to existing menu items and not listed separately.
SIM-Card Inventory:
Information regarding the SIM cards used by the company can now be uploaded to the Asset Management module and directly be managed from there. Additionally, also the links to corresponding devices and contracts can be administered.
Sending SMS regardless of the location of the NetEye appliance
There exists now an alternative for NetEye installations which are shielded from the mobile network and where therefore sending SMS from the location of the appliance is not possible.
By the integration of an adapter it is possible to connect the SMS gateway, which usually has to be attached to the NetEye appliance, to the local network. In this way, the modem can be placed in the optimal point of dispatch. The notifications generated by NetEye, reach the SMS gateway over the local network. This approach can be implemented also for virtual NetEye environments.
New NetEye API
The introduction of an API for NetEye enables the reading of monitoring events and the configuration of monitoring components from thirdparty systems, as for example an existing CMDB.
General enhancements
Reporting
A simplified configuration of reports through the editor of the NetEye Reporting wasintroduced. Moreover, the illustration of availability statistics of distributed monitoring environments is now supported.
Upgrade to SahiPro 6.3
The upgrade to the latest SahiPro version provides, among others, the possibility of password encryption, better performance, and enhanced compatibility with web contents.
In addition, automatic screenshots for intuitive troubleshooting are now reported also for test cases executed on Firefox.
NetEye now also supports the integration of multiple, geographically distributed SahiPro instances.
Event Management
The limitation of the analysis of log events deriving from certain sources, is now possible. This supports the optimization of resource consumption.
AS400 Monitoring
The AS400 monitoring plugin now supports multi-language systems.
VMware SDK
The VMware SDK was updated to version 6.0, to ensure compatibility with the latest VMware infrastructures.
Enhancements in the field of End User Experience Monitoring: Release of Alyvix 2.3
The new Alyvix master release 2.3 comes up with some major enhancements such as controllable precision and accuracy, more detailed reports and new performance storing and publishing capabilities.
Higher robustness and flexibility of graphic detection
User transactions are synthesized in Alyvix keywords, where each keyword defines a graphic element that has to be detected and the way to interact with it.
From Alyvix 2.3 it is possible to visually select one main component and an unlimited number of sub-components, together with their tolerance thresholds, to get a robust description of a transaction, avoiding ambiguity. Moreover, a region of interest, where the element can potentially appear is also defined for every component. Therefore it does not matter if an application is rendered in slightly different manners (e.g. because of a different Internet browser).
Now it is also possible to detect if graphics disappear from the screen.
Adjustable precision and accuracy of performance measurement
Alyvix is able to measure the performance of synthesized transactions with adjustable levels of precision and accuracy depending on the machine hardware where test cases run. In case of a regular (virtual) machine it is possible to achieve a precision of 1 tenth of second (frame grabber period) and an accuracy of 2 tenth of seconds (graphic detector period). With powerful machines both measurement statistics can have a magnitude in the order of tens of milliseconds. These working frequencies can be also set during ongoing test cases and just for a single crucial transaction. At the cost of higher CPU consumption it is possible to improve the correctness of a measure if necessary.
Test cases script a series of Alyvix keywords, each of them outputs its performance, which is the needed amount of milliseconds to visually detect the defined graphic elements, starting from the termination of the previous keyword. The processing time related to the phase of detection, interaction and output is kept out of performance results, leaving the measurements purely net of the real transaction time.
Today test cases can reuse the same Alyvix keyword with different arguments for different purposes. The several performances measured at each step are separately retained and can also be aggregated, thanks to new Perfdata keywords in the Alyvix API.
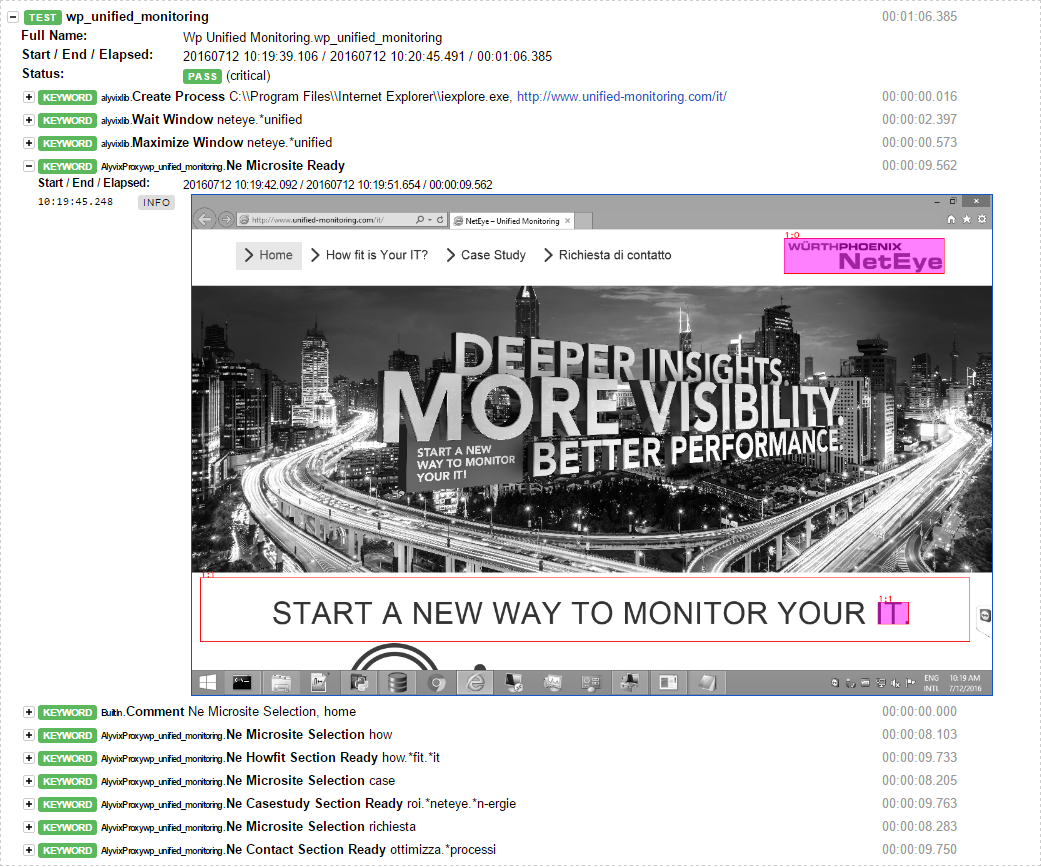
HTML reports of test cases
Alyvix 2.3 generates HTML pages to report performance data and application screenshots to certify that a certain visual appearance was reached. In case a test case fails, a red traffic light is shown at the point of failure, together with an animation (.gif) that highlights the reasons why a certain interface element was not found.
That represents a certification of the quality of service of the application. During the building phase of a test case, reports are the primary troubleshooting tool.
Performance data retention and publication
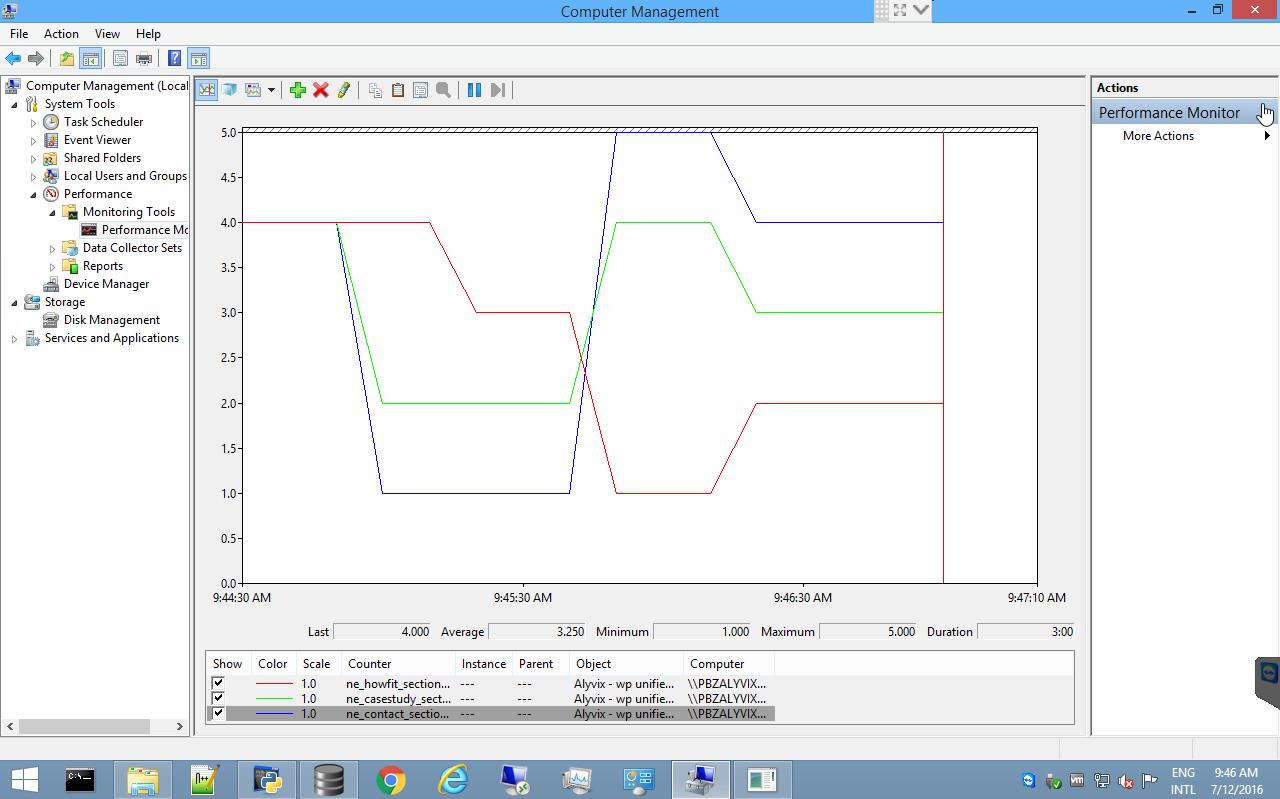
Alyvix 2.3 can retain all the performance data coming from executed test cases within its own Alyvix database. This data can be publish thanks to the Windows Alyvix service (deployed out-of-the-box) in the Windows Performance Monitor. This enables any monitoring system to pull Alyvix measurements, simplifying the integration of test case performances.
NetEye 3.8 upgrade notes
The upgrade from NetEye 3.7 to NetEye 3.8 can be autonomously done on the basis of the documentation provided in NetEye 3.7.
[box]Step 1: Update of the documentation package in NetEye 3.7 through the following command:
“yum –enablerepo=neteye update neteye-documentation”
Step 2: Execution of the upgrade procedure described in the updated documentation.[/box]
The autonomous upgrade will still be possible for all future NetEye minor releases. The requirement for this is a NetEye installation based on CentOS 6 (NetEye 3.6 and higher).
Download the release Note as pdf.

Patrick Zambelli
Project Manager at Würth Phoenix
After my graduation in Applied Computer Science at the Free University of Bolzano I decided to start my professional career outside the province. With a bit of good timing and good luck I went into the booming IT-Dept. of Geox in the shoe district of Montebelluna, where I realized how a big IT infrastructure has to grow and adapt to quickly changing requirements. During this experience I had also the nice possibility to travel the world, while setting up the various production and retail areas of this company. Arrived at Würth Phoenix I started developing on our monitoring solution NetEye. Today, in my position as Consulting an Project Manager I am continuously heading to implement our solutions to meet the expectation of your enterprise customers.
Author
Latest posts by Patrick Zambelli
16. 01. 2024
NetEye, Unified Monitoring
Icinga 2 DSL for Defining the Monitoring Status of Objects with Director
23. 12. 2020
NetEye
Tornado – Getting in Action with Sample Rules
05. 05. 2020
NetEye, Unified Monitoring
Import Data Correlation and Automation with Icinga2 Director