


11. 04. 2024
Business Service Monitoring, NetEye, SLM

19. 09. 2017
Massimo Giaimo
Information Security Operations Center, NetEye
Do you want to prevent cyber-attacks? NetEye and Kibana can help.

IT security is one of the highest priorities for every CIO. Cyber-attacks are now a reality that we must deal with on a daily basis. More and more organizations have been the victims of so-called cybercrimes that are the cause of financial losses, operational problems and consequences to the company’s reputation.
That is why trying to better structure your defenses, and increase efficiency and reactivity in case of an attack, are now key goals for IT departments. How should we adapt to these new needs? One of the most important actions to take is the creation of an Information Security Operations Center, which implements IT security and proactively monitors IT infrastructure.
A new IT Security Management Strategy
Lately, in the Banca Informatica Bancaria Trentina Group where I work, we have increasingly focused on the realization of an Information Security Operations Center. To ensure security and to better control cyber-attacks, we are now leveraging the advantages offered by Kibana and Grafana: Data Visualization Modules integrated into NetEye. These tools allow you to create dashboards that are easy to interpret. More specifically, we focused on the generation of dashboards for infrastructure load (e.g., the CPU usage of the various nodes and the bandwidth load of the switches) and for the security events that allow us to rapidly identify if our organization is under attack.
These dashboards offer a concrete benefit in those situations where it is fundamental to quickly identify the root cause of a problem, such as within an ISOC.
Kibana for the real time visualization of potential cyber-attacks
One of the first tasks to secure an organization, as I’ve written in a recent post on my personal blog (http://www.fastfire.org/2017/09/07/security-of-unorganization-from-where-to-get), is to gather the right information to build clear views on the actual situation.
In our case, it is important to configure the various devices (hosts, switches, routers, firewalls, IoT objects, …) to send their logs to the NetEye Log Manager.
After the execution of this task, we can focus on implementing the dashboards. One aspect we found useful in Kibana is the ability to create a map showing the geolocation of the IP fields contained in the various logs. In our situation, we have used this feature to view the sources of the various attacks. Within our organization, we generated a map that displays the sources of the attacks collected from various datasets created by Snort’s Intrusion Prevention System (IPS) and by various Safed agents installed on our systems. After configuring the IPS so that it can send its evidence to NetEye Log Manager, we created a simple search as follows:
“program:snort OR (“ImapSSLServer” AND “invalid password) OR (“more authentication failures”)
This is just an example of a query that aims to collect attacks from multiple sources into a single dashboard, but of course, it can contain anything that returns usable output even if it is not a real attack. We then added several configurations needed to create the map. Below you can find a step-by-step installation guide for NetEye geolocation:
# cd /var/lib/neteye/logstash/etc
# curl -O “http://geolite.maxmind.com/download/geoip/database/
GeoLiteCity.dat.gz”
# gunzip GeoLiteCity.dat.gz
We then changed the logstash filter files to apply the geolocation data to the IP fields. After that, we added the geoip block where you must enter the name of the field to which you want to apply geolocation (source => “$ field_name”). In our case, we modified the following filters:
Click here to learn more
1_f00200_safed_header.filter (viene applicato a tutti i log inviati a NetEye dall’agent Safed)
else if [type] == “syslog” and [message] =~ /.*Safed\[\d+\]\[\d+\].*ImapSSLServer-.*authentication failed.*/ {
grok {
match => [ “message”, “(?
1_f00450_pfsense_snort.filter (viene applicato a tutti i log inviati a NetEye dall’IDS Snort)
filter {
if [program] == “snort” {
if [message] =~ /.* ET .*{(TCP|UDP)} .*:.* -> .*:.*/ {
grok {
match => [ “message”, “.* ET .*{%{WORD:snort_protocol}} %{IP:snort_src_ip}:%{INT:snort_src_port} -> %{IP:snort_dst_ip}:%{INT:snor
t_dst_port}” ]
remove_tag => “_grokparsefailure”
}
geoip {
source => “snort_src_ip”
target => “geoip”
database => “/var/lib/neteye/logstash/etc/GeoLiteCity.dat”
add_field => [ “[geoip][coordinates]”, “%{[geoip][longitude]}” ]
add_field => [ “[geoip][coordinates]”, “%{[geoip][latitude]}” ]
}
mutate {
convert => [ “[geoip][coordinates]”, “float”]
}
}
}
}
1_f00500_unix_audit.filter
} else if [message] =~ /.*authentication failures;.*user=.*/ {
grok {
match => [ “message”, “.*%{NUMBER:count} more authentication failures;.*rhost=%{IPORHOST:rhost}.*user=%{USER:username}” ]
add_field => [ “audit_type”, “FAILURE” ]
add_tag => “AUDIT_FAILURE”
}
geoip {
source => “rhost”
target => “geoip”
database => “/var/lib/neteye/logstash/etc/GeoLiteCity.dat”
add_field => [ “[geoip][coordinates]”, “%{[geoip][longitude]}” ]
add_field => [ “[geoip][coordinates]”, “%{[geoip][latitude]}” ]
}
mutate {
convert => [ “[geoip][coordinates]”, “float”]
}
}
mutate {
convert => { “count” => “integer” }
}
We then applied the logstash configuration:
# /var/lib/neteye/logstash/scripts/logstash-applyconf.sh
In Kibana we created a new Tile map visualization, specifying geoip.location as the bucket field:
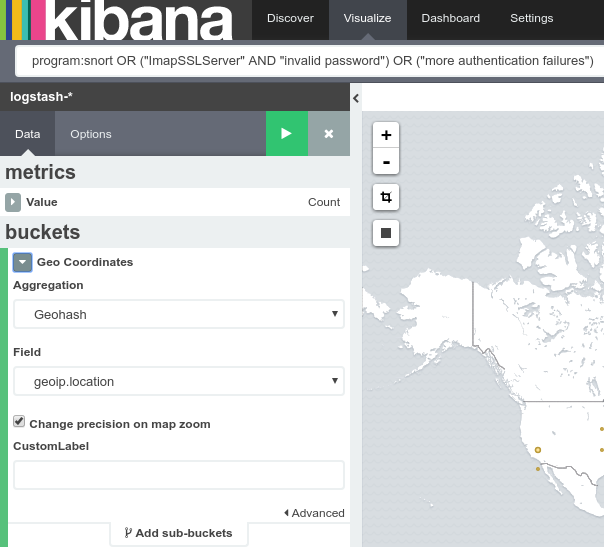
Configuration of the Tile map visualization in Kibana
And finally, we created the dashboard:
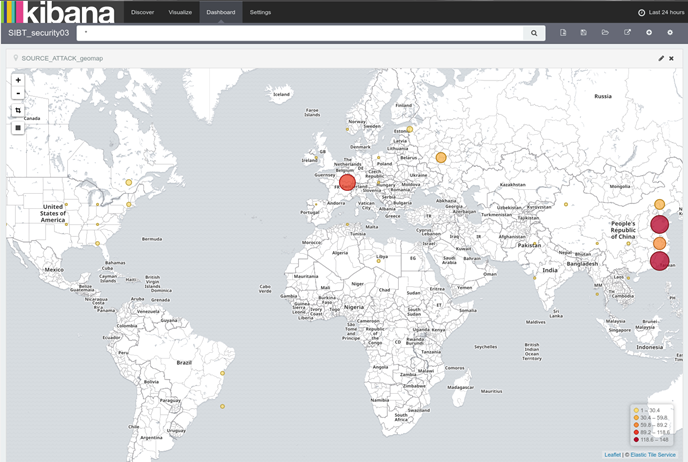
Cyber-attacks’ geolocalization
In this way, we instantly know the geolocation of the sources of potential attacks on our infrastructure. Of course, the potential of this tool has little or no limit: a bit of imagination can help everyone build their own maps according to different needs.
In addition, we built a dashboard in Kibana that allows us to check the trend of the attacks registered by Snort and to identify the IP that are the causes. But that’s not all: we have also included other useful information for our organization’s security, such as any authentication errors to firewall systems and the presence of duplicate IP / MAC addresses in the network, which could for example identify the presence of Man In The Middle attacks.
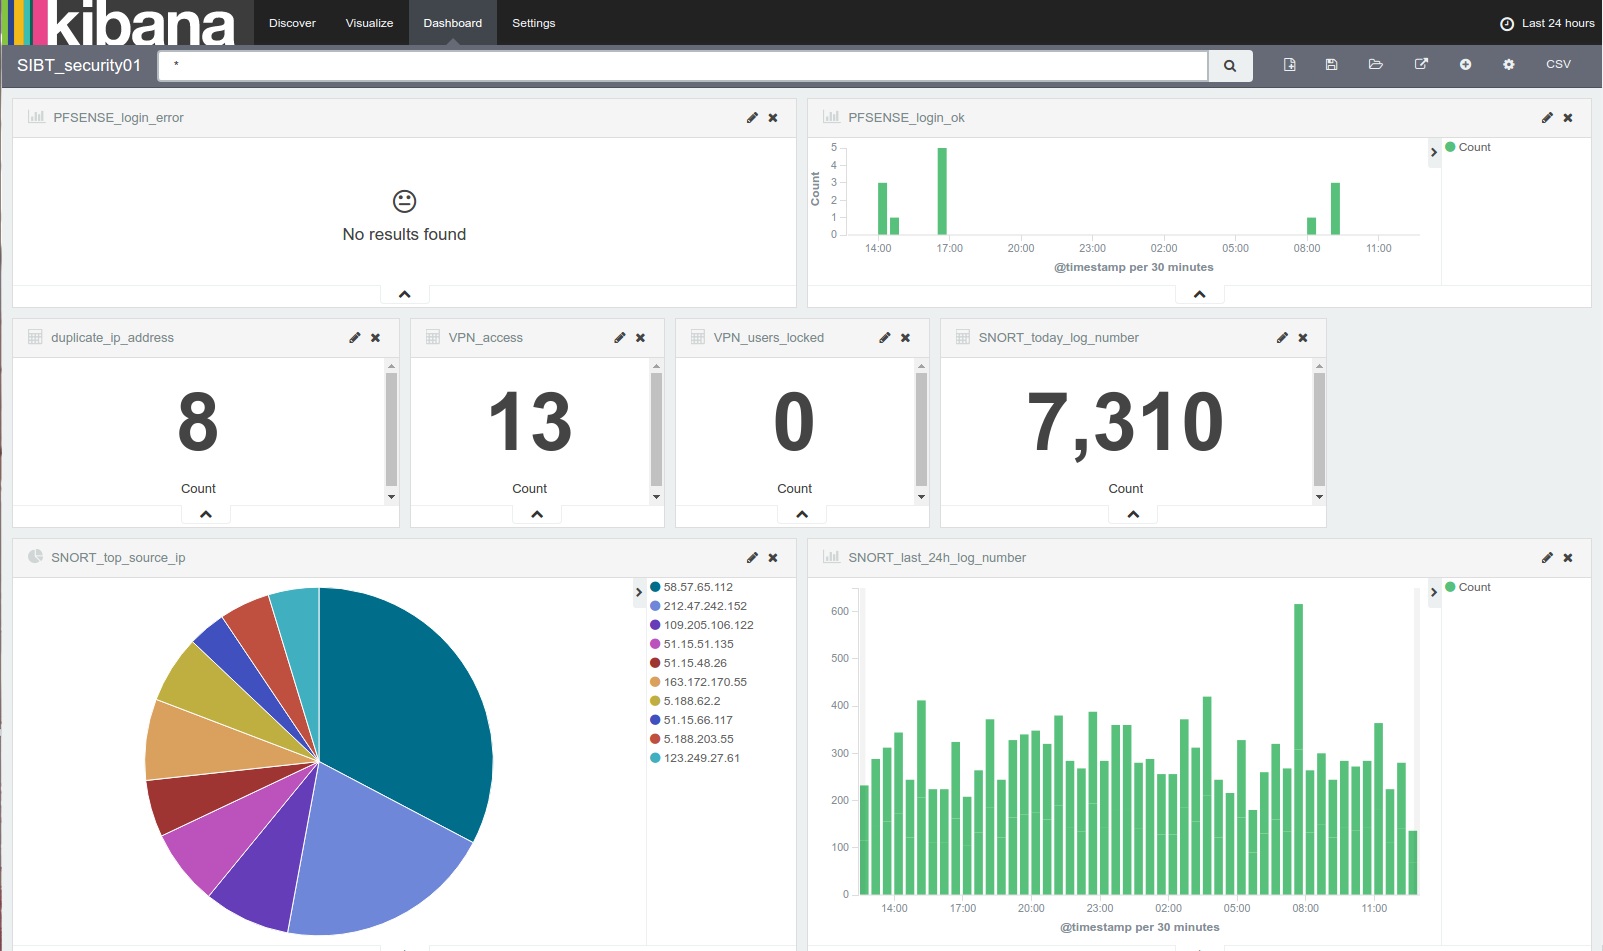
Authentication errors to firewall systems and the presence of duplicate IP / MAC addresses in the network could identify the presence of Man In The Middle attacks.
Verification of the general infrastructure load with Grafana
Another dashboard that helps us in our troubleshooting activities is one we built in Grafana. With the ability to compare multiple outputs in a single graph, we created a dashboard that enables us to view the load of our system infrastructure (both AIX and Linux hosts) and the bandwidth of our switches. Please see the dashboard below:
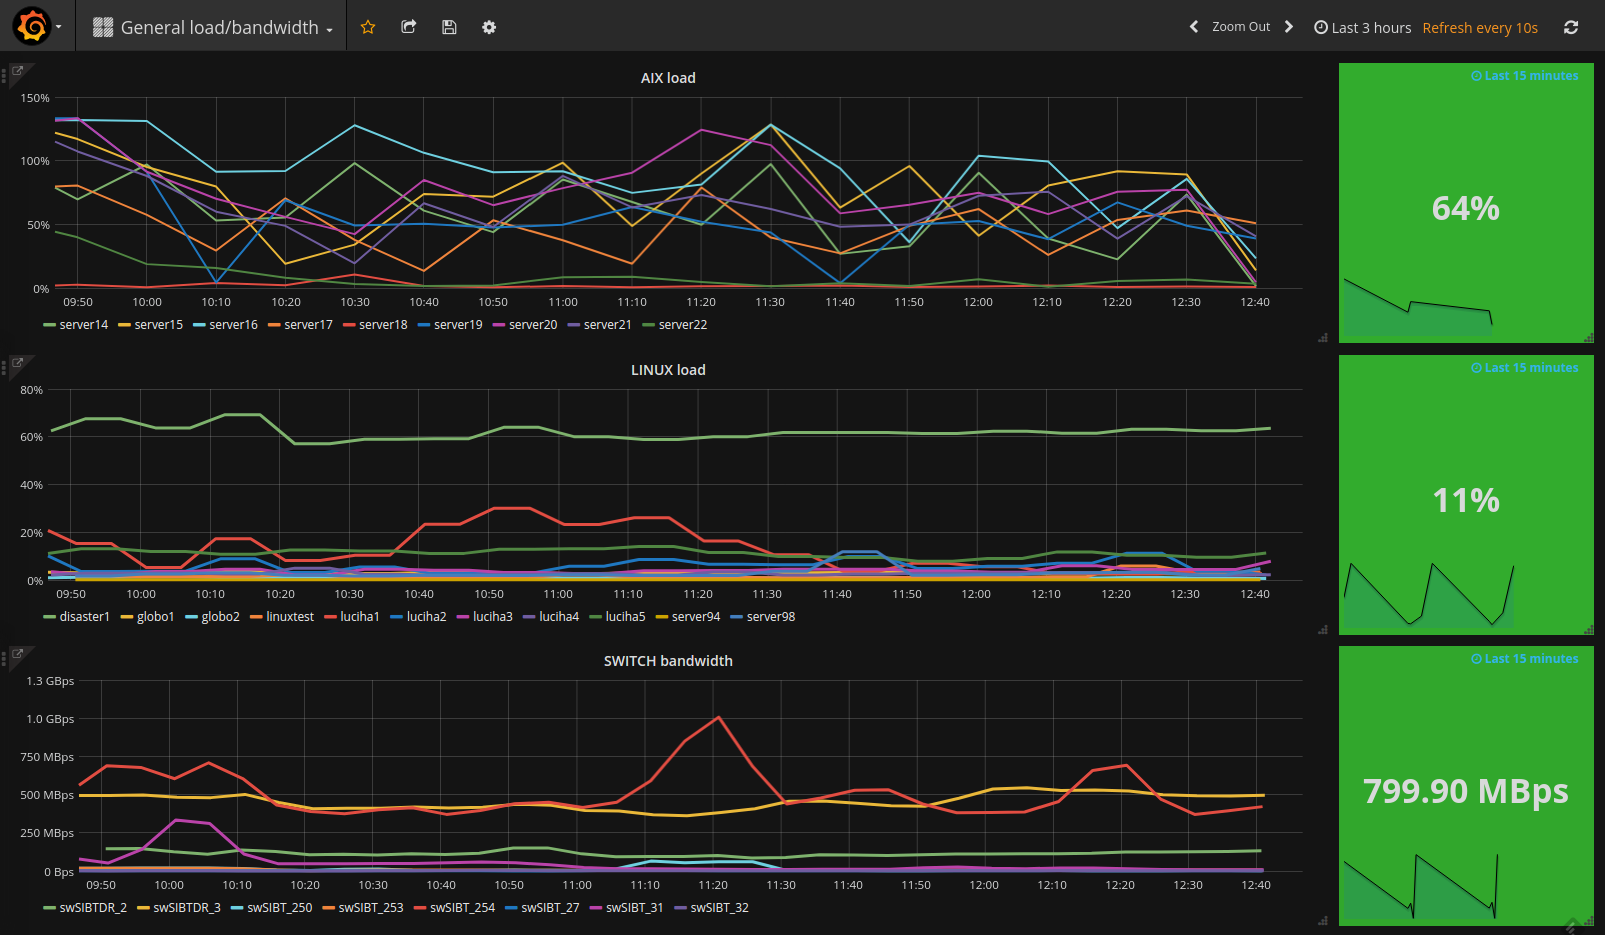
Visualization of the load of our system infrastructure (both AIX and Linux hosts) and the bandwidth of our switches
From this dashboard we can go into more detail by taking advantage of the “Drilldown / detail link” feature of Grafana. For example, by clicking on the “SWITCH bandwidth” link, we can see the details of the switch ports that are generating the most traffic:
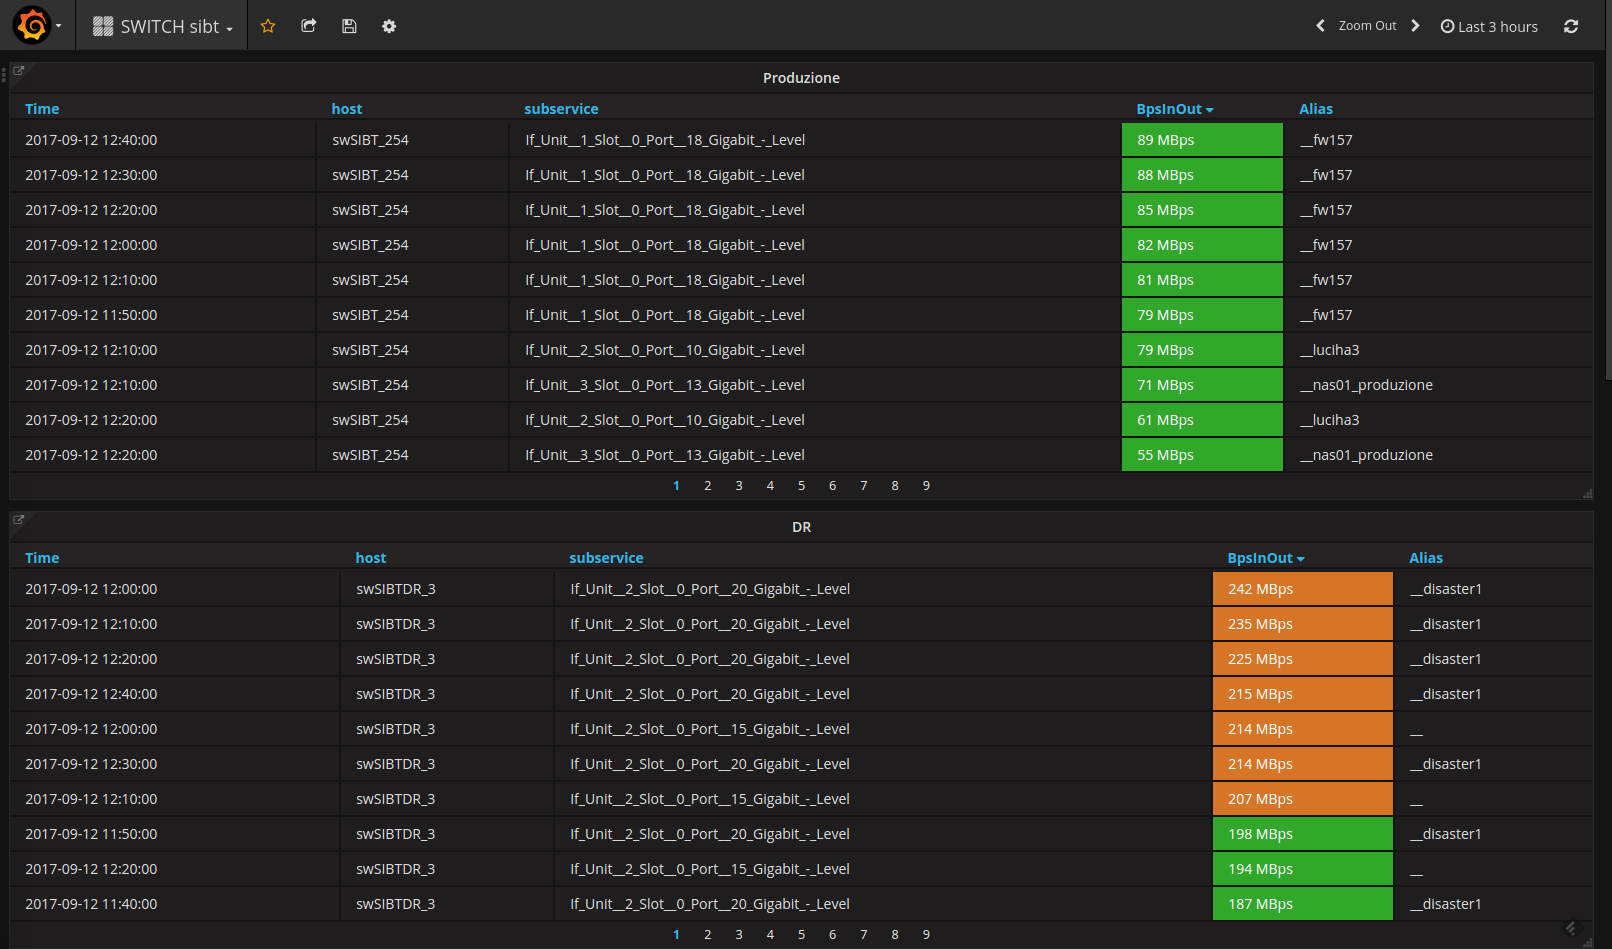
Details of the switch ports that are generating the most traffic.
In general, the integration of ELK (Elasticsearch, Logstash, Kibana) and Grafana into NetEye is giving us great satisfaction, allowing us to concentrate on individual visualizations during our troubleshooting tasks.
Conclusion
Kibana’s integration into NetEye allows us to collect, analyze and automate data to ensure the timely detection of potential cyber-attacks, and help us to take the necessary preventive actions. Thanks to NetEye proactive monitoring, we can work with improved security, focusing on the rapid identification of the root causes of potential problems.

Massimo Giaimo
Team Leader Cyber Security at Würth Phoenix
Author
Latest posts by Massimo Giaimo
21. 03. 2024
SOCnews
SOC News | Mar 21 – IABs and Bulk Sales
03. 02. 2024
SOCnews
SOC News | Feb 04 – AnyDesk Compromise