30. 06. 2026
Azure, Cloud, Microsoft, NetEye, NetEye Extension Packs, Unified Monitoring

Doing my work as monitoring consultant, I often have to monitor Nutanix systems on customer site. Nutanix is a integrated systems vendor that produces a hyper-converged storage system called “Virtual Computing Platform”.
It is quiet easy to monitor the Nutanix system and with NetEye you will be able to get the best results and visualization possibilities.
You will monitor the Nutanix system by using the SNMP protocol:
First, you have to enable the SNMP protocol on the Nutanix site. Then you can use the check_nutanix.pl from the Nagios exchange website. Implement this plugin on the NetEye solution and you can for example actively monitor clusterIops, cluster latency, and so on. For getting working this plugin, you have to load the Nutanix MIB’s on the NetEye system.
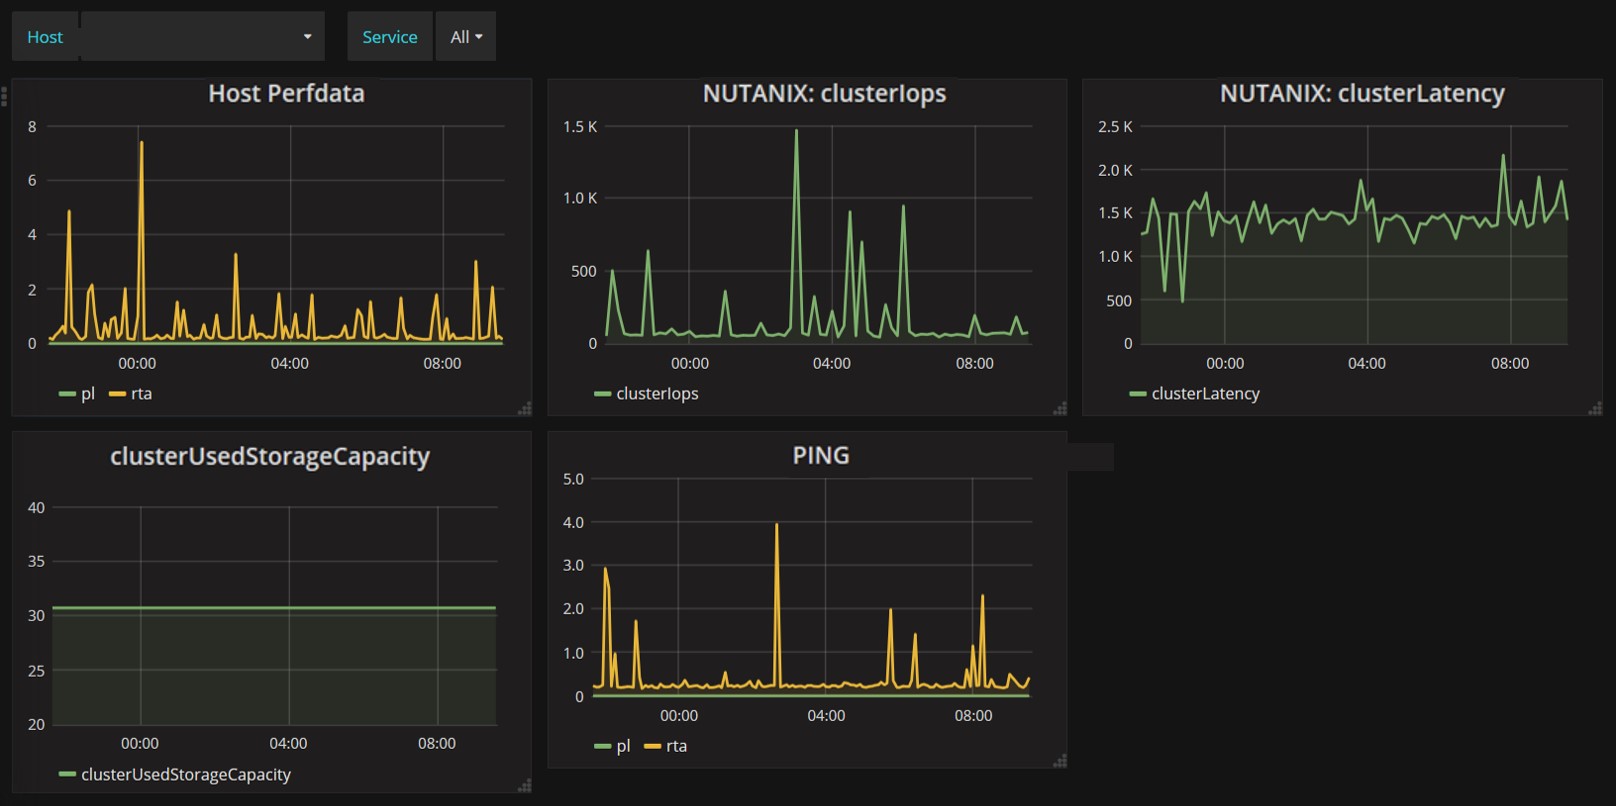
On the NetEye system the performance data output of the Nutanix checks will be automatically loaded into the influx database, in this way you are able to visualize the data on a Grafana dashboard.
See picture:
Furthermore, you can enable on the Nutanix system the SNMP trap alerting. As destination host, you configure the NetEye server. Afterwards, you have to configure the NetEye Eventhandler to collect the SNMP Trap events from Nutanix, which change the state of a passive NetEye check. With this alerting possibility, you are able to monitor special events, which you are not monitoring actively.
On the following picture, you can see possible active checks and the passive check for the SNMP trap alerting:

Finally, you can see that with the NetEye solution you are able to do active monitoring, passive monitoring and you will get a very contemporary view of the performance data with the Grafana and Influx integration into NetEye.

Tobias Goller
NetEye Solution Architect at Würth IT Italy
I started my professional career as a system administrator.
Over the years, my area of responsibility changed from administrative work to the architectural planning of systems.
During my activities at Würth IT Italy, the focus of my area of responsibility changed to the installation and consulting of the IT system management solution WÜRTHPHOENIX NetEye.
In the meantime, I take care of the implementation and planning of customer projects in the area of our unified monitoring solution.
Author

Latest posts by Tobias Goller
16. 02. 2026
Unified Monitoring
OpenShift Monitoring in NetEye
13. 10. 2025
Log-SIEM, Unified Monitoring
Elastic Defend: Experiences
18. 07. 2025
Automation, Cloud
Running SOS Berlin JobScheduler in Containers: A Step Toward Cloud-Native Scheduling
16. 04. 2025
NetEye, Unified Monitoring
Application Performance Monitoring in NetEye with Elastic APM and OpenTelemetry