
23. 12. 2020
Stefano Bruno
NetEye, Unified Monitoring
The NagVis module: Adding a Grafana Panel on Mouse-over
Hi everyone, in this article I want to tell you about the NagVis module and how we’re going to customize a template so that it can allow us to modify the information displayed during mouse-over (hover).
Basically, what we’ll try to achieve will be to preview the performance graphs written on Influx via an additional Grafana plugin. By default, the information that can be displayed is the following:
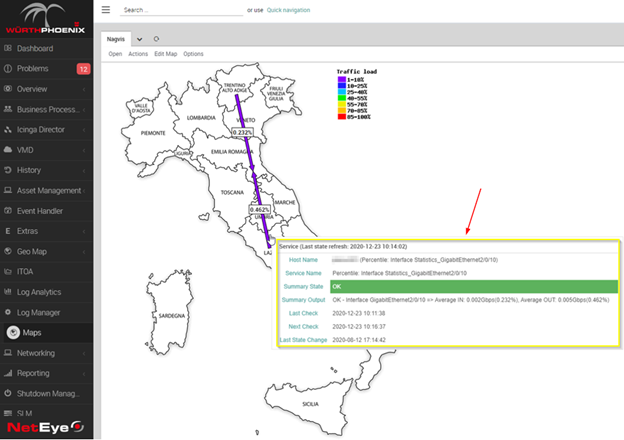
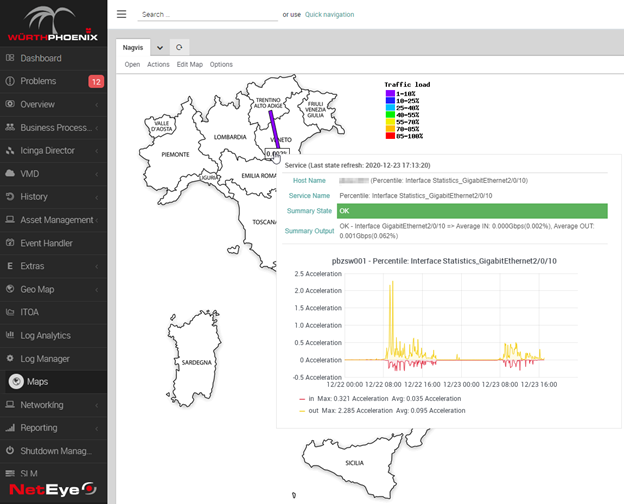
We’ll enrich this information by inserting the relative bandwidth graph in order to be able to quickly see the network traffic trends without having to reload our page.
Plugin Installation
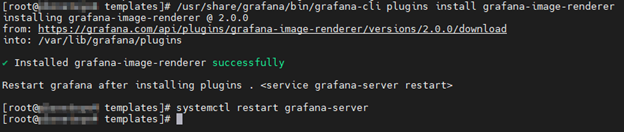
The requirement to enable this feature is to install the grafana-image-renderer plugin, which can render Grafana dashboard panels in .PNG format:
/usr/share/grafana/bin/grafana-cli plugins install grafana-image-renderer
systemctl restart grafana-server
Grafana: Create a Dashboard Template
We need a Grafana Dashboard template that we will use to render the image. There are three preparatory steps:
Grafana: Variables
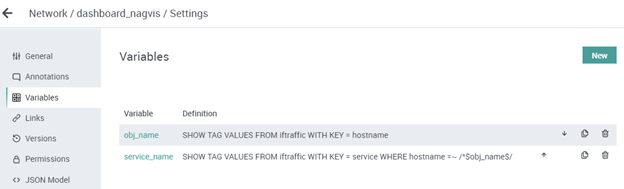
First, configure the variables that will allow us to dynamically switch between the various hosts and services during our NagVis mouseover:
Grafana: Query
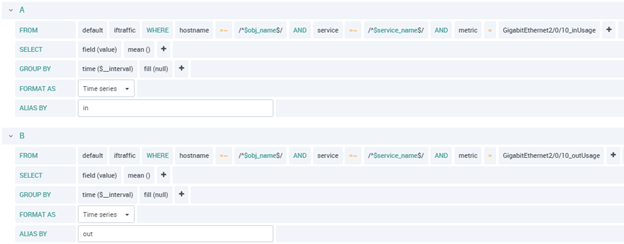
Next, let’s create a simple query to visualize the Network traffic:
Grafana: Panel
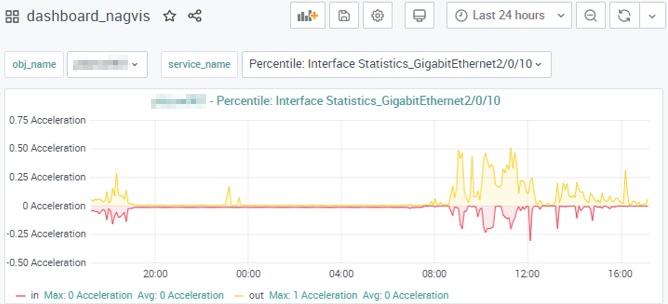
Now create the panel and test it with the Grafana drop-down menu.
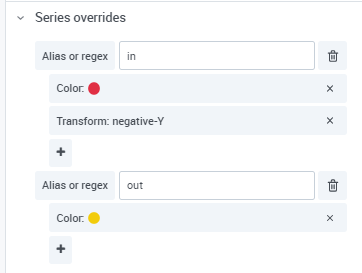
I suggest using series override to visualize inBandwidth and outBandwidth with positive and negative values along the Y axis:
The final result should look something like this:
NagVis: Template Creation
Now we’re ready to create the template for our new on-hover action with a bit of HTML:
[root@neteye4 templates]# cat new.hover.html
<table class="hover_table" style="width:600px">
    <tr><th colspan="2">[lang_obj_type] ([lang_last_status_refresh]: [last_status_refresh])</th></tr>
    <tr><td class="label"><label>[lang_name]</label></td><td>[obj_name][obj_alias_braces]</td></tr>
    <tr><td class="label"><label>[lang_service_description]</label></td><td>[service_description]</td></tr>
    <tr><td class="label label[obj_summary_state]"><label>[lang_summary_state]</label></td><td class="state[obj_summary_state]">[obj_summary_state] [obj_summary_in_downtime][obj_summary_acknowledged][obj_summary_stale]</td></tr>
    <tr><td class="label"><label>[lang_summary_output]</label></td><td>[obj_summary_output]</td></tr>
    <tr><td colspan="2" class=child>
        <table class=childs width="100%">
    <tr><td class="label" style="height:320px"><td><img src="../../../neteye/analytics/grafana/render/d-solo/j2ZqWafdRs/dashboard_nagvis?orgId=1&from=now-24h%2Fd&to=now%2Fd&var-obj_name=[obj_name]&var-service_name=[service_description]&panelId=4&width=560&height=300&tz=Europe%2FRome"></td></tr>
        </table>
    </td></tr>
</table>
Simply duplicate the existing CSS style file and set the correct owner to the new HTML file we just created:
cp -p default.hover.css new.hover.css
chown apache:apache new.hover.html
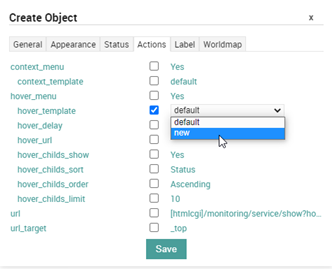
Now we can change the template in our NagVis object with the GUI editor by selecting the “new” template:
And finally, we can see the complete result of our new mouse-over action:
Conclusion
It’s very important to be able to get a quick overview of the performance graphs of the monitoring objects present in NagVis. It keeps us from having to switch from one browser tab to another, saving a lot of time especially when viewing maps full of monitoring objects such as one with dozens of switch interfaces.

Stefano Bruno
Consultant at Würth Phoenix
Dear all, I'm Stefano and I was born in Milano.
Since I was a little boy I've always been fascinated by the IT world. My first approach was with a 286 laptop with a 16 color graphic adapter (the early '90s).
Before joining Würth Phoenix as SI consultant, I worked first as IT Consultant, and then for several years as Infrastructure Project Manager, with a strong knowledge in the global IT scenarios: Datacenter consolidation/migration, VMware, monitoring systems, disaster recovery, backup system.
My various ITIL and TOGAF certification allowed me to be able to cooperate in the writing of many ITSM Processes.
I like to play guitar, soccer and cycling, but... my very passion are my 3 baby and my lovely wife that has always encouraged me and helped me to realize my dreams.
Author

Latest posts by Stefano Bruno
13. 07. 2020
NetEye, Service Management, SLM, Unified Monitoring
ITSM Ticketing Integration with NetEye