24. 09. 2015
Real User Experience

The use of containers has now become part of our everyday activities. In many cases we use them as software appliances or black-boxes. Sometimes, however, these black-boxes don’t work as we expect, or we’d like to be able to evaluate their performance as the load increases.
Today we’re going to talk about a real use case, data collection using one or more Gotenberg containers. Gotenberg is an API that allows you to convert and manipulate documents in PDF format in a way that’s easy for developers. It receives files via HTTP (multipart/form-data) requests and returns the processed document without requiring you to manually configure complex dependencies on your server.
One of our customers has been using it for about a year, having integrated it into their PHP-based application. And as often happens, after an initial testing phase we began encountering some performance problems.
Fortunately, in one of the latest releases, we implemented the functionality of exporting performance data via telemetry, and we were able to integrate this data into the APM component of NetEye together with the PHP application data.
Anticipating an increase in load, the customer asked us to implement a new solution consisting of a reverse proxy that would balance the load between three Gotenberg containers. To these we added a container to serve as a local OTel collector that would take care of forwarding the collected data to the NetEye platform.
The Gotenberg Container Configuration
x-gotenberg-base: &gotenberg-base
build:
context: ./gotenberg
dockerfile: Dockerfile
image: ${GOTENBERG_IMAGE:-gotenberg:custom}
environment:
- GOTENBERG_CHROMIUM_AUTO_START=true
- GOTENBERG_CHROMIUM_RESTART_AFTER=0

# OTEL CONFIGURATION
    - OTEL_EXPORTER_OTLP_PROTOCOL=http/protobuf
    - OTEL_TRACES_EXPORTER=otlp
    - OTEL_METRICS_EXPORTER=otlp
    - OTEL_LOGS_EXPORTER=otlp
    - OTEL_EXPORTER_OTLP_ENDPOINT=${OTEL_COLLECTOR_OTLP_HTTP_ENDPOINT:-http://otel-collector:4318}
    - OTEL_EXPORTER_OTLP_INSECURE=true
    - OTEL_RESOURCE_ATTRIBUTES=service.name=gotenberg,deployment.environment=staging
    - OTEL_TRACES_SAMPLER=always_on

networks:
    - gotenberg_net
  restart: unless-stopped

services:
  gotenberg:
    <<: *gotenberg-base
    # no ports: instances are reachable only via the internal network
    health-check:
      test: ["CMD-SHELL", "curl --fail http://127.0.0.1:3000/health || exit 1"]
      interval: 30s
      timeout: 10s
      retries: 3
      start_period: 10s

networks:
  gotenberg_net:
    external: true
This configuration allows us to maintain a single configuration regardless of the number of Gotenberg containers we might want to run. The health-check function will be used by NetEye to verify the operation of the different containers.
The OTEL-COLLECTOR
The OTEL-COLLECTOR is also containerized. The configuration extracts the crucial information from the .env file present in the root of the project. Here’s an example.
.env file
# Common values shared by compose files
PROJECT_NAME=gotenberg
OTEL_COLLECTOR_HOST=otel-collector
OTEL_COLLECTOR_OTLP_HTTP_ENDPOINT=http://otel-collector:4318
GOTENBERG_IMAGE=gotenberg:custom
APM_ENDPOINT=https://myapmendpoint:8200
APM_TOKEN=mysupersecrettoken
compose.yml
services:

  otel-collector:
    image: otel/opentelemetry-collector-contrib:latest
    container_name: otel-collector

    ports:
      - "4317:4317"
      - "4318:4318"

    volumes:
      - ./otel/collector-config.yaml:/etc/otel/config.yaml:ro

    environment:
      APM_ENDPOINT: "${APM_ENDPOINT:?APM_ENDPOINT is required}"
      APM_TOKEN: "${APM_TOKEN:?APM_TOKEN is required}"

    command: ["--config", "/etc/otel/config.yaml"]

    networks:
      - gotenberg_net

    restart: unless-stopped

networks:
  gotenberg_net:
    external: true
collector-config.yml
receivers:
  otlp:
    protocols:
      grpc:
        endpoint: "0.0.0.0:4317"
      http:
        endpoint: "0.0.0.0:4318"

processors:
  batch:
  memory_limiter:
    check_interval: 5s
    limit_mib: 400
    spike_limit_mib: 64

exporters:
  otlp_http/elastic:
    endpoint: "${APM_ENDPOINT}"
    headers:
      Authorization: "Bearer ${APM_TOKEN}"
    tls:
      insecure_skip_verify: true
  debug:

service:
  pipelines:
    traces:
      receivers: [otlp]
      processors: [memory_limiter, batch]
      exporters: [otlp_http/elastic, debug]
    metrics:
      receivers: [otlp]
      processors: [memory_limiter, batch]
      exporters: [otlp_http/elastic, debug]
    logs:
      receivers: [otlp]
      processors: [memory_limiter, batch]
      exporters: [otlp_http/elastic, debug]
Go!
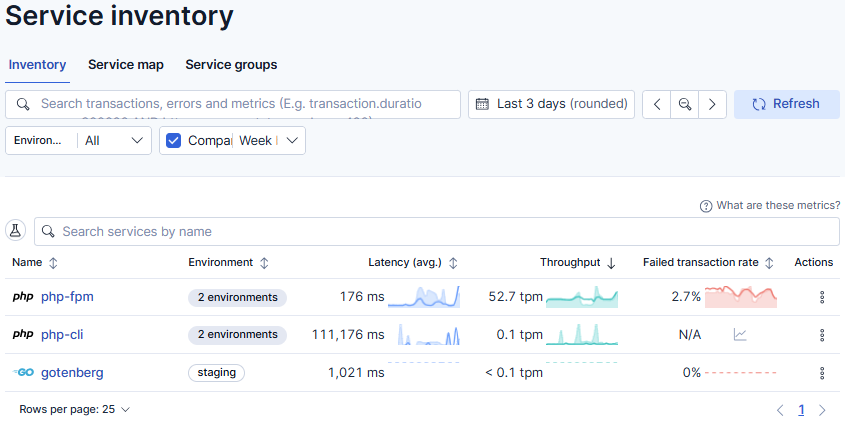
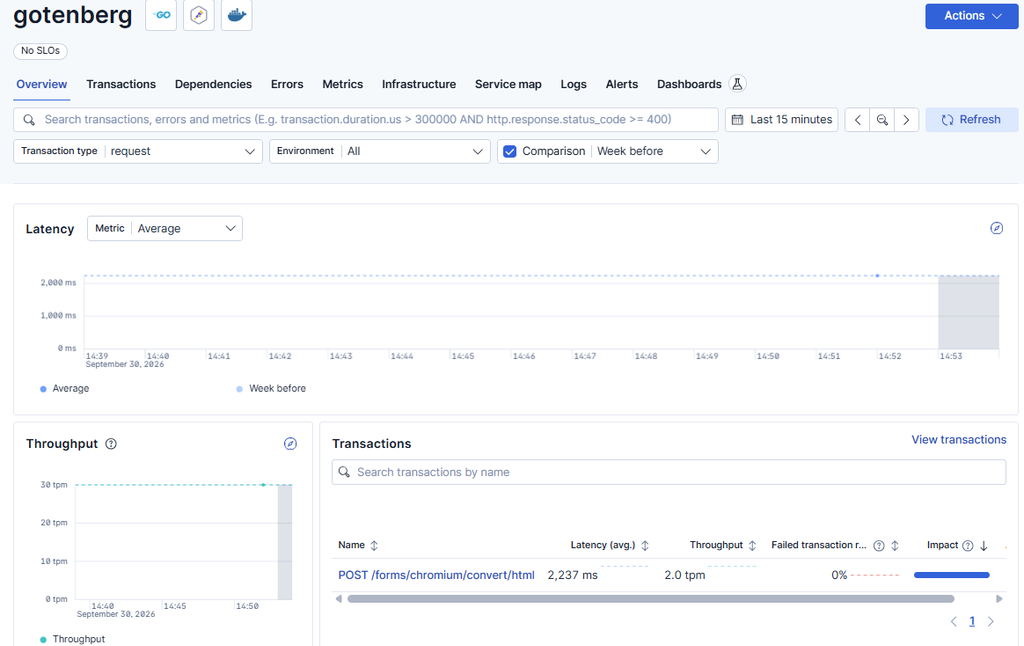
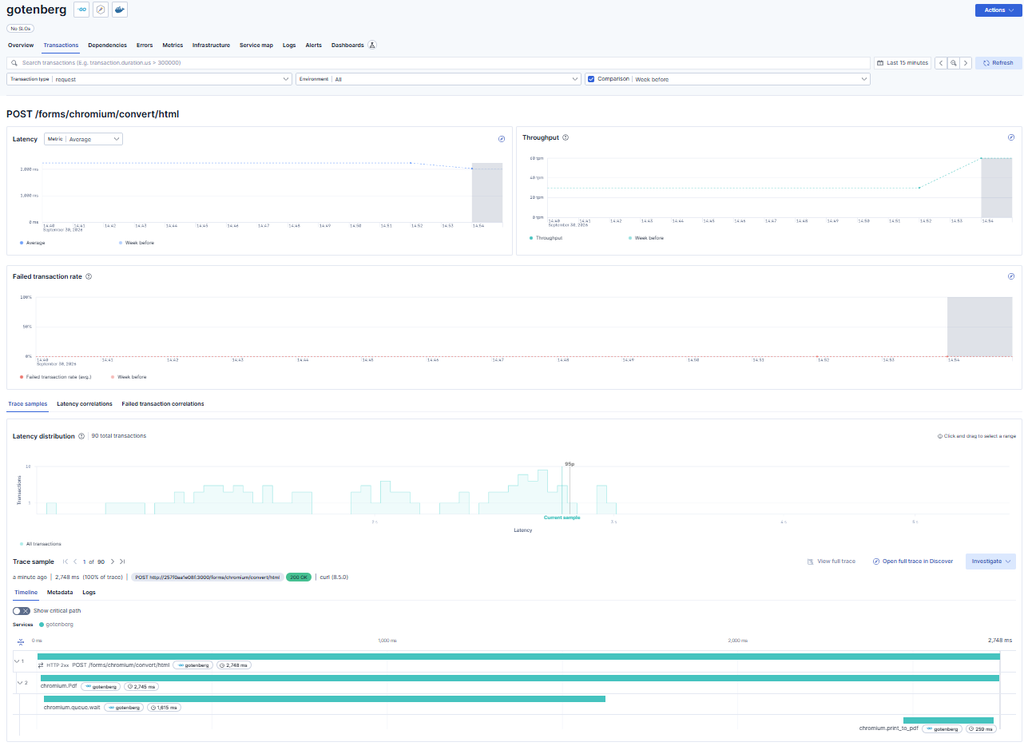
Let’s run the container, try a test print and verify the data sent by the collector on the Elastic APM component.
Final Notes
That’s it.
As you can see, this makes it very easy to monitor the inner workings of a third-party container.
Write us to let us know whether you have any doubts, or are just curious.
These Solutions are Engineered by Humans
Are you passionate about performance metrics or other modern IT challenges? Do you have the experience to drive solutions like the one above? Our customers often present us with problems that need customized solutions. In fact, we’re currently hiring for roles just like this as well as other roles here at Würth IT Italy.

Paolo Seghetti
Author

Latest posts by Paolo Seghetti
30. 06. 2026
Azure, Cloud, Microsoft, NetEye, NetEye Extension Packs, Unified Monitoring
New NEP Coming Soon: Monitor Your Office 365 Tenant Subscriptions with Confidence
22. 05. 2026
AI, NetEye, Unified Monitoring
An AI Approach for Old SNMP Devices
30. 03. 2026
NetEye, Unified Monitoring
SNMP and Non-connected Interfaces
28. 12. 2025
Automation, Business Service Monitoring, Icinga Web 2, NetEye, Service Management
Automating Notifications in NetEye
30. 09. 2025
NetEye, Unified Monitoring
Business Process Automation on NetEye