15. 06. 2026
NetEye, Unified Monitoring

10. 01. 2018
Benjamin Gröber
NetEye, Unified Monitoring
How to Build Dashboards for NetEye Monitoring Events Using Grafana as a MySQL Datasource
In the latest releases of our dashboarding solution, Grafana, support for new relational datasources is included. These new datasources give us the ability to build native dashboards with relational datasets. In this blog I’d like to walk you through building up a high level dashboard for monitoring events.
The data we want to query is distributed among several tables in the log cache database. As always, the first step is reasoning about what data we want to show and which fields we want to abstract over by moving them into variables. Here we are interested in events of a certain type for a particular service on a particular host. (Grafana gives us the time dimension for free.)
Creating a MySQL Datasource
Adding new datasources in Grafana is as easy as it gets. In the datasource tab of Grafana you just add a MySQL datasource.
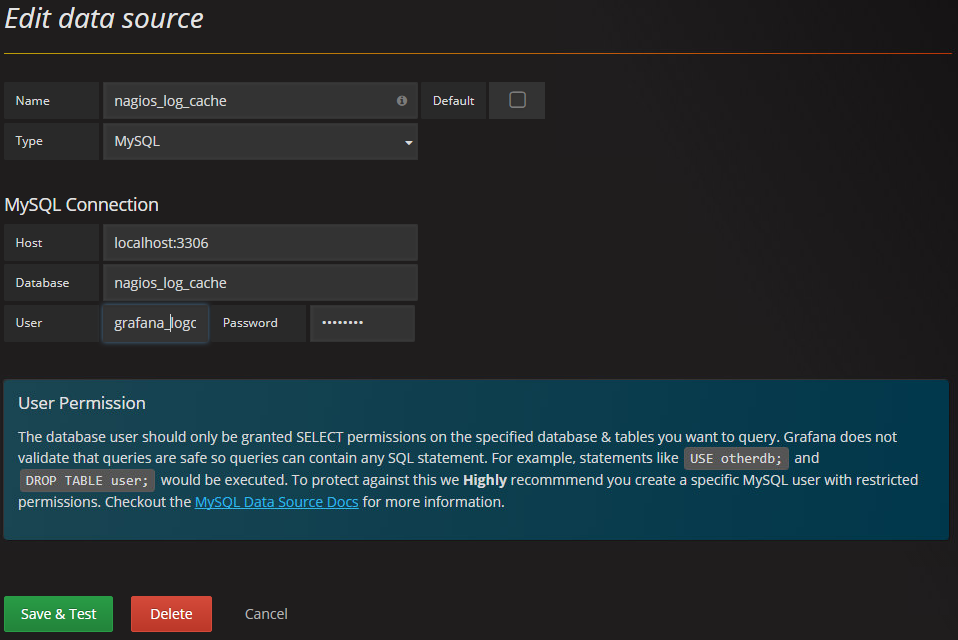
MySQL users within the Grafana module should have very limited permissions for security and safety reasons.
In the database of your choice you should have a dedicated user either for this specific datasource, or overall for Grafana, but in any event granting only SELECT permissions, as the input is currently not sanitized.
Building the Query
If we want to deal with timeseries data and graph it, we would have to translate Grafana’s timeseries semantics into the relational world. Grafana limits us here to one timestamp column, which must be in the form of a Unix epoch. MySQL is capable of converting date/datetime into Unix epochs using the UNIX_TIMESTAMP() function, but luckily in our dataset we already have Unix timestamps.
However we’re interested in a table, which simplifies things for us as we can use our usual MySQL semantics.
A first attempt might be something similar to this:
 SELECT from_unixtime(l.time) as 'time', l.type, l.state, l.state_type, s.service_description, pa1.output AS 'message', pa2.output AS 'plugin_output'
 FROM `ac6e0_log` l
 JOIN `ac6e0_service` s ON l.service_id = s.service_id
 LEFT JOIN `ac6e0_plugin_output` pa1 ON pa1.output_id = l.message
 LEFT JOIN `ac6e0_plugin_output` pa2 ON pa2.output_id = l.plugin_output
 WHERE l.time >= $__unixEpochFrom() AND l.time < $__unixEpochTo()
 ORDER BY l.time DESC
 LIMIT 1000
As you’ll probably notice, we are now left with a list of all events in the timeseries, which is not exactly what we want.
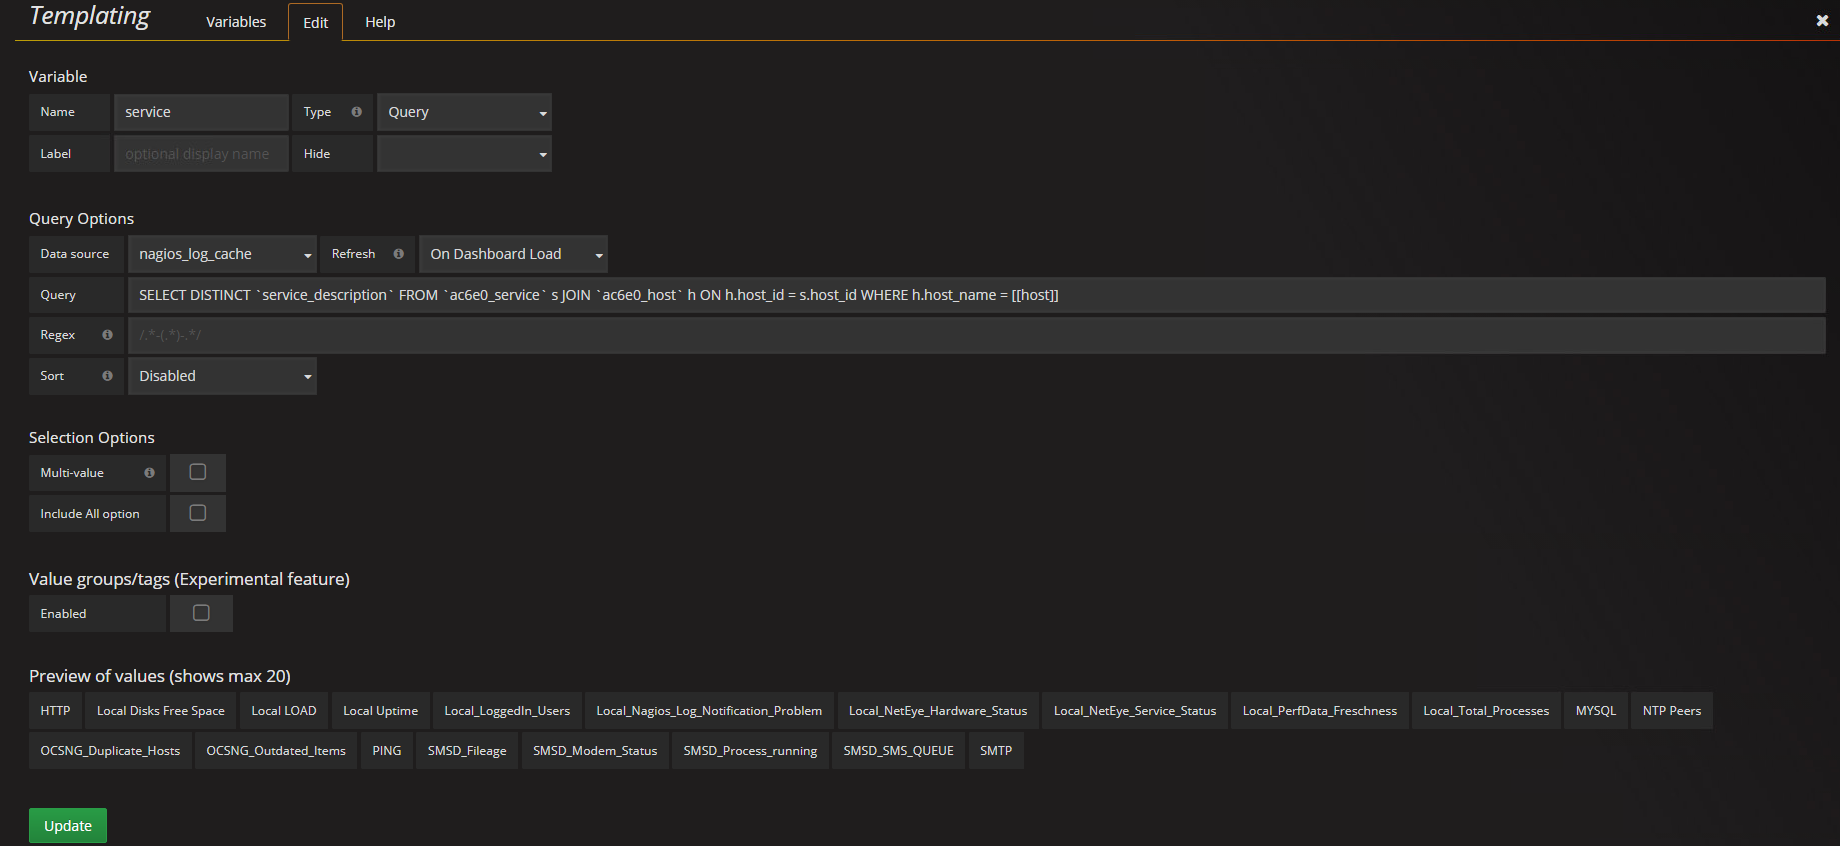
Templating
Grafana has a powerful mechanism called templating, which allows us to use lists or query results to define possible values for variables, which can then be used in dashboards. These queries are executed at a certain point in time (e.g., when loading the dashboard) and let us use one, many, or all values of the result in queries of the related dashboard.
Let’s add two of these:
1. HOST QUERY
SELECT DISTINCT host_name from ac6e0_host
2. SERVICE QUERY
SELECT DISTINCT `service_description` FROM `ac6e0_service` s JOIN `ac6e0_host` h ON h.host_id = s.host_id WHERE h.host_name = '[[host]]'
Templating variables can contain previously defined templating variables.
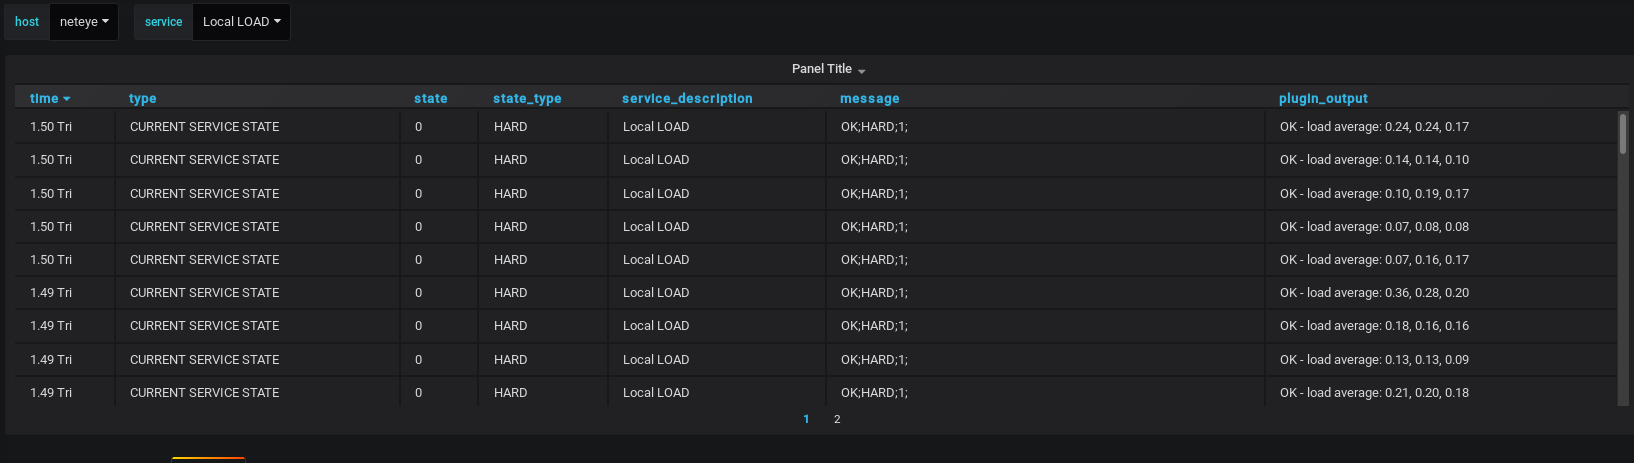
Once we include these variables in our dashboard using the [[varname]] format, we have the following query:
SELECT from_unixtime(l.time) as 'time', l.type, l.state, l.state_type, s.service_description, pa1.output AS 'message', pa2.output AS 'plugin_output'
FROM `ac6e0_log` l
JOIN `ac6e0_service` s ON l.service_id = s.service_id
LEFT JOIN `ac6e0_plugin_output` pa1 ON pa1.output_id = l.message
LEFT JOIN `ac6e0_plugin_output` pa2 ON pa2.output_id = l.plugin_output
LEFT JOIN `ac6e0_host` h ON s.host_id = h.host_id
WHERE s.service_description = '[[service]]' AND h.host_name = '[[host]]' AND l.time >= $__unixEpochFrom() AND l.time < $__unixEpochTo()
ORDER BY l.time DESC
LIMIT 1000
Done! By combining the above techniques you’ll be able to build complex yet comprehensible views from your MySQL instances as timeseries.
Resources
MySQL Datasource http://docs.grafana.org/features/datasources/mysql/
Templating http://docs.grafana.org/reference/templating/
Monitoring Log Cache https://www.thruk.org/documentation/logfile-cache.html

Benjamin Gröber
R&D Software Architect at Wuerth Phoenix
Hi, my name is Benjamin, and I'm Software Architect in the Research & Development Team of the "IT System & Service Management Solutions" Business Unit of Würth Phoenix.
I discovered my passion for Computers and Technology when I was 7 and got my first PC. Just using computers and playing games was never enough for me, so just a few months later, started learning Visual Basic and entered the world of Software Development. Since then, my passion is keeping up with the short-lived, fast-paced, ever-evolving IT world and exploring new technologies, eventually trying to put them to good use. I'm a strong advocate for writing maintainable software, and lately I'm investing most of my free time in the exploration of the emerging Rust programming language.
Author
Latest posts by Benjamin Gröber
25. 11. 2022
Development
What is the perfect development team size?