IT Service Status Aggregation for Distributed Monitoring Scenarios
With this article I will talk about a recent customer project on End User Experience within a distributed environment.
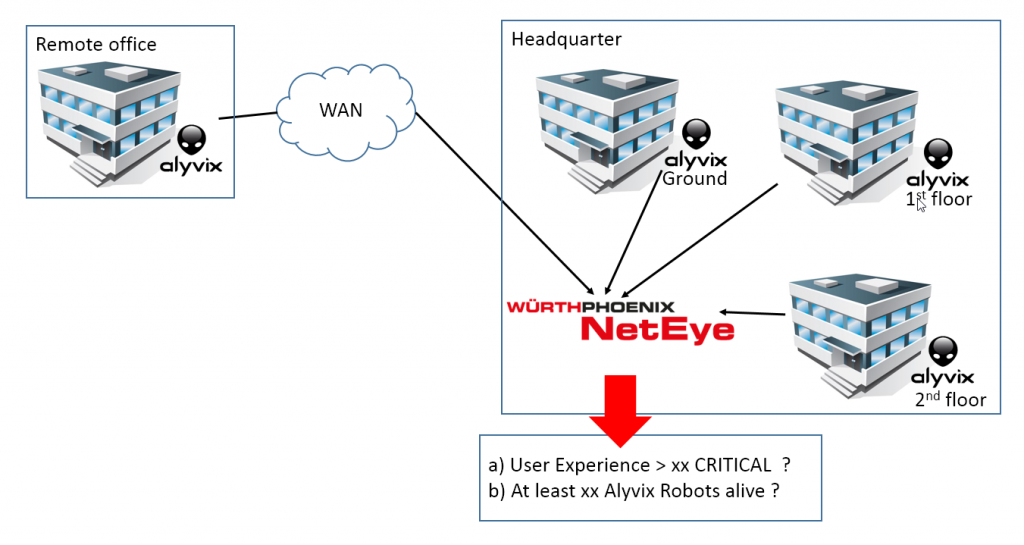
When we use the word “distributed”, we usually think about sites distributed across multiple cities or continents. This project focused on monitoring the quality that IT users experience between the ground floor and the 2nd floor within the same building, and to compare it to users accessing the same IT application from a remotely located building. All in all, we only covered a limited area, but with a focus on identifying underestimated network latency or network misconfigurations affecting a limited number of users on the various segments of the local network.
Another benefit of this approach is to provide the IT service desk with a detailed view of the service quality on various floors of the building and thus a tool to improve comprehension when users complain about performance issues.
Here’s a simplified schema of the monitoring architecture of Alyvix robots collecting user experience data, and the central NetEye system for data collection and evaluation:
From the introduction above we can distinguish 2 main topics for this project:
- Can I reliably identify a major IT incident for a provided service – thus excluding topical problems on the network, or even the incident of an Alyvix robot ?
(VM failure, accidental testcase failure) - Provide an IT support team with views of the building, floor, and department levels
Item #2 can be solved by creating the appropriate Analytics dashboards that I will show later. For item #1 a new logic would be needed, because the traditional Business Process (BP) logic with its AND, OR, and N-OR aggregators does not provide the necessary logic.
I have implemented this logic through a script with the aims of avoiding new complexity and remaining compatible with Nagios/Icinga2 and could therefore be used both for NetEye 3 and our new NetEye 4. It queries the current monitoring status of all Alyvix robots and performs the required calculations:
- Does the number of all Criticals reported by Alyvix exceed a configurable tolerance threshold?
(We opted for a Warning if 2 Criticals are detected, and a Critical for 3. The number of Alyvix robots is 9.) - Is the expected number of Alyvix robots operational?
(We exclude situations of “Downtime” and “Acknowledged Incidents”. There must be at least 3 remaining explicit “OK” states.)
This new check is implemented in the standard way in NetEye 3 as follows (monitoring with Alyvix is integrated as introduced at http://www.alyvix.com)

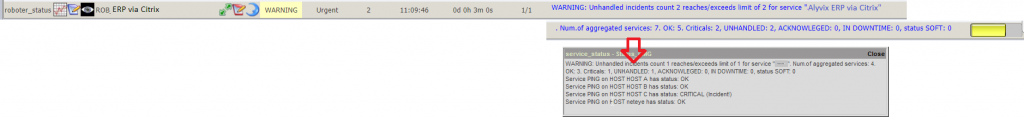
The “aggregator” check is implemented and provides the following details:
- Overall status: Warning, because 2 Criticals have been reported
- The total number of Alyvix robots evaluated
- The number of OK results
- The number of Criticals, distinguishing between INCIDENT (not handled), Acknowledged, in Downtime, and Soft state (not confirmed, yet)
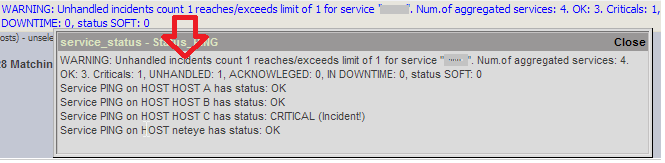
Resized image with higher zoom level:
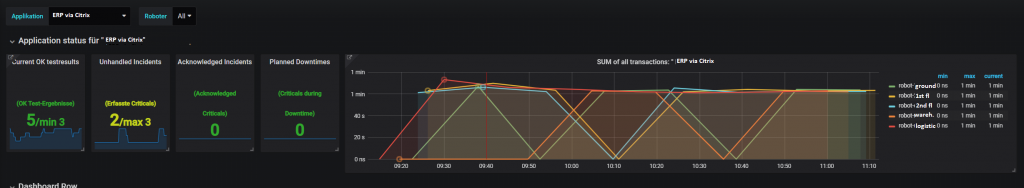
These metrics are exported as performance data and can be therefore be used to create intuitive visualizations in NetEye’s Analytics module:
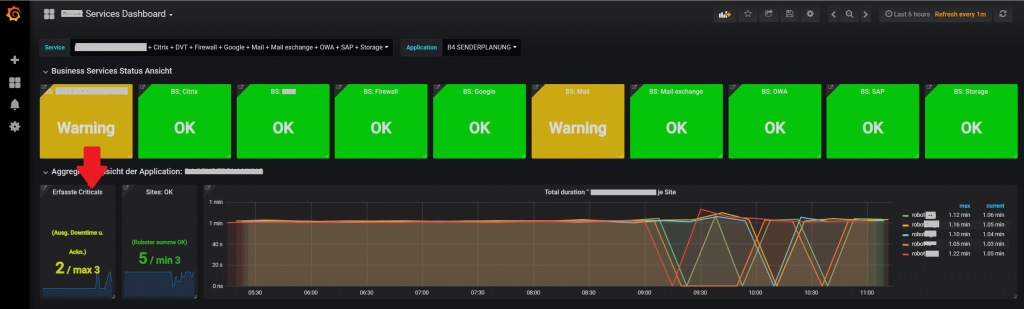
This leads to the creation of Business Services via NetEye ‘s BP modules and Status Dashboards like this:
Implementing the Service Aggregation check
The plan for this logic is to integrate it into the standard release for both NetEye 3 and NetEye 4. Until then, you can download the check_service_aggregator.sh (see section “Downloads” below) to the Plugins folder of NetEye:
NB: For manually installed Plugins you should choose the extra / local folder, in order to avoid conflicts with distribution-provided Plugins.
- NetEye 3.x: /usr/lib64/nagios/plugins/local (create it if it does not exist)
- NetEye 4.x: /neteye/shared/monitoring/plugins
Call syntax of Plugin: check_service_aggregator.sh
check_service_aggregator.sh -s SERVICE_NAME [-w MAX_NUM_OF_INCIDENTS] [-c MAX_NUM_OF_INCIDENTS] [-W MIN_NUM_OF_OK] [-C MIN_NUM_OF_OK]
Advice for using livestatus on NetEye 4: The path is different than NetEye 3, but you can already find the appropriate line to uncomment for NetEye 4: Go to line 86 and comment out that line used by NetEye 3.
Usage example:
[root@neteye local]# ./check_service_aggregator.sh -s PING -w 1 -c 2 -W 1 -C 2
 WARNING: Unhandled incidents count 1 reaches/exceeds limit of 1 for service "PING". Num.of aggregated services: 4.
 OK: 3. Criticals: 1, UNHANDLED: 1, ACKNOWLEDGED: 0, IN DOWNTIME: 0, status SOFT: 0 | ok_services=3;1;2 critical_incidents=1;1;2 critical_acknowleged=0;; critical_downtime=0;;
 Service PING on HOST HOST A has status: OK
 Service PING on HOST HOST B has status: OK
 Service PING on HOST HOST C has status: CRITICAL (Incident!)
 Service PING on HOST neteye has status: OK
Download:
Update: find latest version on github: check_service_aggregator.sh