18. 03. 2025
Icinga Web 2, ITOA, NetEye, UI, Unified Monitoring

Scenario
Cisco WLC is widely used by many Enterprise Companies to manage their wireless networks due to its efficiency and advanced features.
Its management web console has a wealth of configuration parameters, but it doesn’t offer a clear overview on what’s happening across the wireless network.
Fortunately, a lot of real time information is available through Cisco’s SNMP interface.
Centralized Monitoring
With a centralized monitoring solution like NetEye, it would be great to integrate and then visualize the metrics collected by the Cisco WLC Controller.
The real problem is to focus on the right metrics, namely those that describe the wireless Access Points and client status.
How To
The easiest way to collect SNMP data and pull it into NetEye is through a Telegraf agent.
The procedure is described in the publicly available NetEye 4 Community Portal on zampat github. The documentation there is for NetEye 4, but the same basic setup procedure also applies to NetEye 3. The setup details are described here:
https://github.com/zampat/neteye4/tree/master/monitoring/monitoring-plugins/wireless/cisco
We have tested several Cisco 25xx devices under NetEye monitoring, but it should also work on other Cisco WLC models.
A group of MIB files should be added to NetEye to be able to poll SNMP alias values and avoid unreadably long OID strings. Then a sample Telegraf configuration file is provided with the most important metrics to be collected.
Remember to allow NetEye as an SNMP poller in the Cisco WLC configuration!
The collected data will be stored in an Influx database (remember to set the right data retention policy to avoid uncontrollably growing your DB!), ready to be displayed through the Grafana web interface.
Presenting Data with Grafana
The GitHub project provides a few Grafana dashboards that can be directly imported into NetEye. They are in Grafana 5 format, so be sure that if you have NetEye 3, that the system is updated with the latest release!
Of course, the Dashboards can be customized and integrated with other metrics.
Cisco WLC General Information:
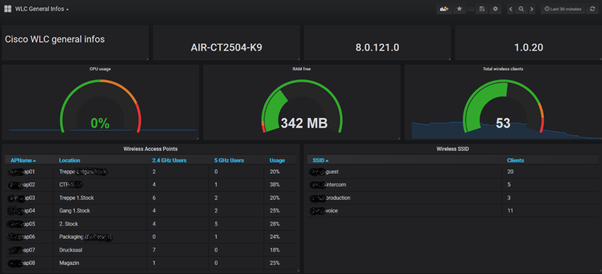
Here you can see the WLC model, firmware and boot versions, CPU, RAM, client loads and the client real time distribution per Access Point (2.4 GHz and 5 GHz channels) or per SSID.
WLC Clients:
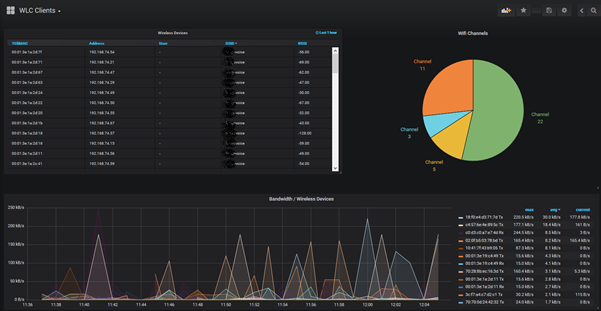
Here you can find detailed information about each wireless client: IP address, User name (if the SSID requires authentication), signal strength in dB and the traffic generated.
WLC Access Points:
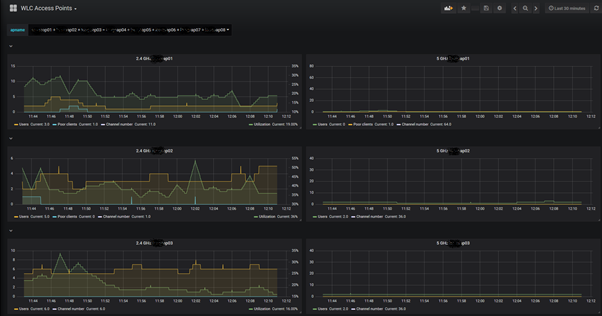
Here you can select the Access Points from a list and get detailed information about the number of connected users, those with poor signal (if any), and the active channel number.
A lot of metrics are collected from Cisco WLC, and even more can be added. I advise you to take a deeper look at Cisco’s MIBs to find other interesting ones.

Alessandro Romboli
Site Reliability Engineer at Würth IT Italy
My name is Alessandro and I joined Würth Phoenix (now Würth IT Italy) early in 2013. I have over 20 years of experience in the IT sector: For a long time I've worked for a big Italian bank in a very complex environment, managing the software provisioning for all the branch offices. Then I've worked as a system administrator for an international IT provider supporting several big companies in their infrastructures, providing high availability solutions and disaster recovery implementations. I've joined the VMware virtual infrastructure in early stage, since version 2: it was one of the first productive Server Farms in Italy. I always like to study and compare different technologies: I work with Linux, MAC OSX, Windows and VMWare. Since I joined Würth Phoenix, I could also expand my experience on Firewalls, Storage Area Networks, Local Area Networks, designing and implementing complete solutions for our customers. Primarily, I'm a system administrator and solution designer, certified as VMware VCP6 DCV, Microsoft MCP for Windows Server, Hyper-V and System Center Virtual Machine Manager, SQL Server, SharePoint. Besides computers, I also like photography, sport and trekking in the mountains.
Author
Latest posts by Alessandro Romboli
17. 06. 2026
Microsoft
UEFI Secure Boot Nightmare
03. 12. 2025
Microsoft
Single Sign-On for Power BI Report Server
08. 09. 2025
Service Management
VMware ESXi Transparent Page Sharing
12. 06. 2025
Microsoft
Terminal Server User Profiles with FSLogix