11. 02. 2025
Development, Events, NetEye

15. 02. 2023
Giacomo Flavio Adriano Pilotti
Events, NetEye, Service Management, Unified Monitoring
FOSDEM 2023
After two years of a forced break caused by the pandemic, we were finally able to book a flight to Brussels and participate in the FOSDEM event again. For those who aren’t familiar with it, FOSDEM is a free event for software developers to meet, share ideas and collaborate.

Apart from the amazing experience overall, we met the real people behind many projects we use every day, and had the chance to discover many new interesting technologies that we might integrate with our products. Here’s a summary of some of the most interesting talks that inspired us.
Talk: DNF5 – The New Era in RPM Software Management
Surely all NetEye users will be familiar with the RedHat and Fedora package manager: DNF.
We had the pleasure of listening to Nicola Sella, Jan Kolárik, and Aleš Matěj, three Red Hat software engineers, who are working on the development of DNF5.
This new version of DNF has been completely rewritten by removing the dependency on Python!
Among the many improvements, the most significant is definitely the improved performance due to the optimization of metadata downloading. Another notable change is the reduction in the number of software management tools, making the use of microdnf, for example, obsolete and no longer necessary.
DNF5 will be available by default and will replace DNF starting with Fedora 39, but already with Fedora 37 you can install and try it out.
We’ll also see it soon in NetEye!
Talk: CI/CD for Machine Learning Models
In the session dedicated to Continuous Integration and Continuous Development, we had the opportunity to attend a talk held by Alex Combessie, one of the co-founders of Giskard, a quality platform for AI models.
In the talk, besides briefly presenting their product, Alex Combessie addressed a really important point when it comes to the development and integration of machine learning models in a product: How can we effectively test them?
Sure, for most software products we can usually write unit and integration tests to ensure the different components behave as expected, and that the end result also respects our idea, but how can we apply this to ML models? Can we write unit/integration tests to ensure they perform well in production?
As you can imagine, it turns out that standard testing techniques cannot generally be applied well to ML models. However, this doesn’t mean we should avoid testing our models! In particular, we are still able to perform quite a good range of tests on our models, such as:
- Performance tests: how well is the model performing on a selected test set?
- Data drift tests: tests like the Chi-Square and other statistical tests to understand if the data on which a model was trained and the data which it is applied to differs in terms of properties, since in real-world scenarios the mutations in our world also influence the resulting data we can collect, leading to outdated models.
- Behavioral tests: tests in which we modify the initial data to observe whether a specific expected behavior of the model actually happens (like performing some typos in a text and checking if the model is still able to classify it correctly).
- Fairness tests: adopting measures, like the 80% rule, to check if a model is biased with respect to a certain variable, such as the country.
As you can see, the talk gave us some interesting ideas about how to test ML models but, perhaps even more importantly, made us reflect on the importance of appropriately testing our models.
Talk: Is “European Open Source” a Thing?
NetEye is built on decades of Free and Open Source Software, standing on the shoulders of giants to reach new heights, and working every day to provide the best possible product. We also give back to the open source community by contributing to Icinga 2, the base of our product, and by open-sourcing our own software like Tornado.
We had the pleasure of participating at an open debate, led by Gaël Blondelle from the Eclipse Foundation, and Alberto P. Martí from OpenNebula Systems. After some leading thoughts from the presenters we discussed many points around open-source software and the European Union. Some questions discussed were:
- What does the term “European open source” mean?
- How is open-source utilized in Institutions all over Europe?
- What is the current position of Europe in the broader open-source ecosystem?
- What can European legislatures do to further the open-source movement and profit the public in the process?
- What are steps we can take to achieve Europe’s resilience and digital sovereignty in the decades to come?
and much more.
Talk: pip Install Malware
The average cost of a data breach is 4.35 million euros. 19% of breaches are caused by stolen/compromised credentials (not via phishing). This means that developers are a target for this type of malware. Hackers often attempt RCE (Remote Code Execution) when trying to steal credentials, install ransomware, or cryptomining/diversion.
But most importantly, those developers who install libraries can also be the target!
Our packages, as developers, behave as expected buuut….. they include vulnerabilities, use outdated versions of libraries, etc…and the Python Package Index (PyPI) doesn’t help (it’s not the safest place in the world…): 3% of PyPI packages are estimated to be involved in typosquatting. 0.5% of PyPI downloads are estimated to be for typosquatting packages.
One of the techniques adopted to spread malware from PyPI is the misspelling typosquat. Let’s look at some real examples found for the requests package: rrequests, requesys, _equests. Another type of typosquat technique is the confusion typosquat, which leverages those users who misremember the name of a package, confuse the ordering/separators, or the versioning. Confusion typosquat examples are: dotenv-python (using python-dotenv), requests3 0.0.0 (using requests 3.0.0), and libcurl (using pycurl).
There are also some other ways to deliver malware from PyPI, for example via dependencies. I.e., an innocent looking package might behave as expected to avoid suspicion…but has malicious dependencies!
Another one is to have malicious commits over time: a project is safe and contains no malware, builds a user base, and only then is malware added. Example: fastapi-toolkit 0.0.27. Or a repo gets a new maintainer who adds malware…
There is also the possibility to make your package look super famous and thus become more used with starjacking: PyPI does not check the relationship between a package and its linked GitHub repo. This means that anyone can link to any package of any project on GitHub. Result: there are some malicious PyPI packages with more than 70.000 downloads because people trusted the GiHub repo summary.
But what can we do to protect ourselves and our users from attackers? As maintainers we could use automated scanning tools to check our dependencies. As package users, avoid typing package names into shells (use pip install -r requirements.txt) and use automated scanning tools. But as always the best solution is just to always be aware of what we are doing.
Talk: Talk to D-Bus from a Python Application
D-Bus is a message bus system which supports interprocess communication. If you’ve ever worked with the dbus low-level API or with the D-Bus protocol, you might have noticed its complexity. In this talk, Vendula Poncova illustrated the dasbus Python library core concepts while performing a live demo.
The dasbus library offers an easy-to-use solution to utilize D-Bus in your application without the need to worry about the underlying protocol. For example, one of the simplifications is that the library gets rid of the tedious XML syntax which is used to define the objects, and lets you create them directly in Python using some library-specific decorators. Other features discussed were:
- Managing D-Bus names
- Generating D-Bus paths
- Handling D-Bus errors
- Handling D-Bus structures
- Using Unix file descriptors
Overall, the library seems a good alternative to libdbus if you want to integrate D-Bus in your application, but you don’t want to learn the complex protocol specifications.
Talk: Loki: Logging, But Make It Cloud Native
FOSDEM offered a series of very interesting talks about Monitoring and Observability, and one of the talks that got our attention is Loki: Logging, but make it cloud native.
Loki is a project developed by Grafana and describes itself as a “time series database, but for strings”. It serves as a log aggregation system and aims at collecting logs from across an IT environment to help administrators manage and analyze their infrastructure logs.
Loki offers various advantages with respect to the typical way logs are inspected, i.e., access the hosts, identify where the logs of a given service are written, and inspect them with a combination of tail and grep commands.
First of all, Loki allows you to gather all logs in a single place, which lets you easily navigate through logs of different services or of different hosts. Obviously it’s well integrated with Grafana, which offers a specific type of datasource for Loki that allows it to query logs via the LogQL query language.
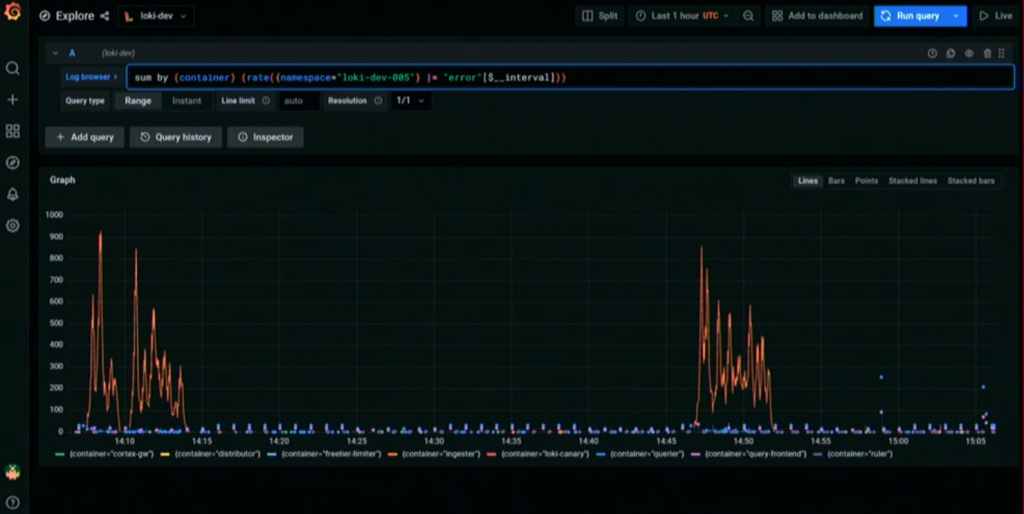
Querying the logs via Grafana allows for some really interesting possibilities besides just inspecting the list of logs that match your query. What it additionally enables is building metrics based on logs, and defining dashboards and alerts based on these metrics. For example, if you’re interested in monitoring the occurrence of a particular error in the logs, you can construct a simple query like the following and understand with just a glance what’s happening:
In case the software you want to monitor is your own, you could certainly build such metrics and dashboards in a more structured way by instrumenting the software to expose just the information that you need.
But what Loki allows you to do with respect to software instrumentation is that you can build the metrics at query-time based on logs, which means that you can define what you are interested in in real time, and also inspecting the metrics retroactively. With software instrumentation instead, you need to define beforehand what the metrics are that you want to monitor, and if for example during an incident you see that some metrics are missing, you won’t be able to understand what happened during the incident because the correct information will only be available after re-instrumenting the software.
Another very interesting part of Loki is that it offers a nice integration with Grafana Tempo, the distributed tracing backend of Grafana, thanks to which you can easily relate logs to traces and vice versa via Grafana.
These Solutions are Engineered by Humans
Did you find this article interesting? Does it match your skill set? Programming is at the heart of how we develop customized solutions. In fact, we’re currently hiring for roles just like this and others here at Würth Phoenix.