30. 06. 2026
Azure, Cloud, Microsoft, NetEye, NetEye Extension Packs, Unified Monitoring

In NetEye environments we use Tornado to collect events, elaborate on them, and send notifications based on them from a lot of sources (syslog, email, SNMP traps and so on). In this article I’d like to suggest a different use case: how to use Tornado to monitor your cron jobs. In our example we want to use NetEye to track the status of a sequence of dependent scripts.
Suppose you need to weekly run a script composed of three commands: the first two extract data from different sources, while the third one merges the previously extracted data. For each script we want to keep track of the results in NetEye. We also want to be notified when any script is not executed.
Here the three scripts :
- extract-info-source1
- extract-info-source2
- merge-sources
Host and Service Creation
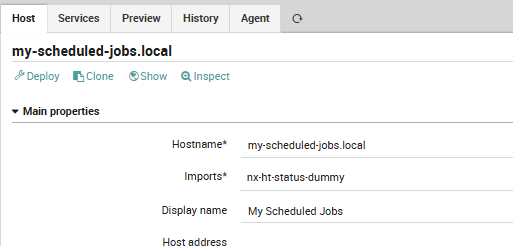
We begin by creating a dummy host:
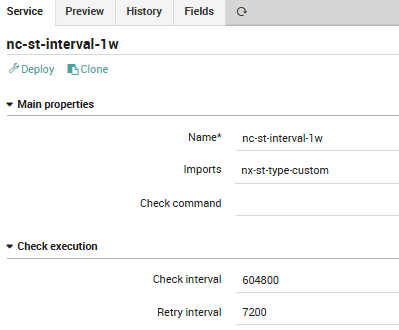
then creating (if it’s not already present) a service template with a check interval:
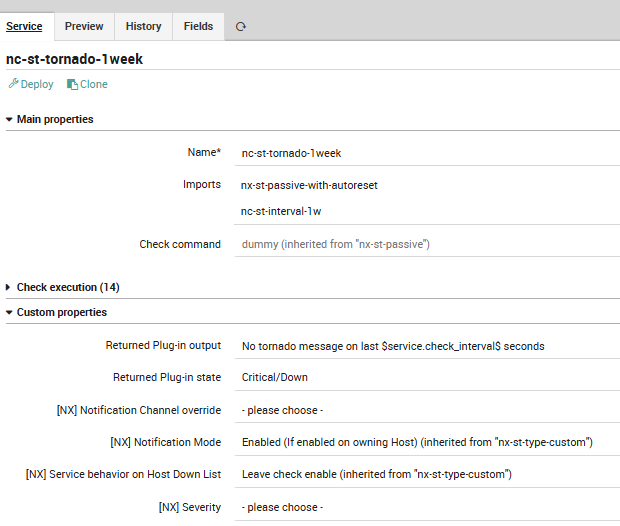
and next a service template with an auto-reset delay of one week:
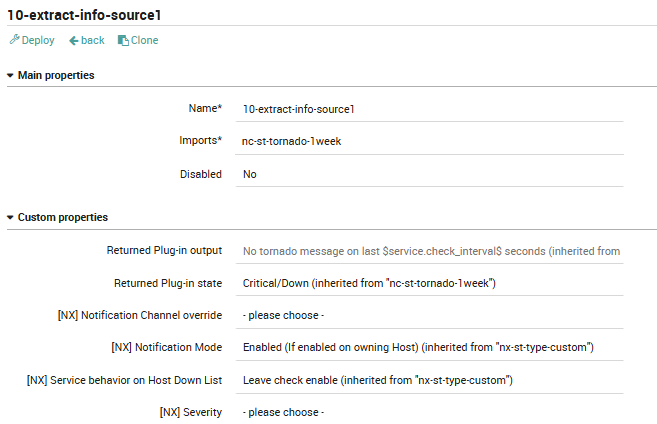
Finally, create the three services (here’s the first one):
Deploy the configuration in Director and we’ll now have our host/services ready to be used:
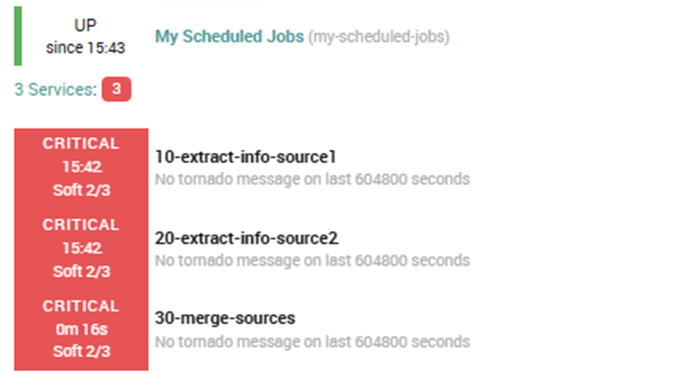
That’s it for today. In my next article we’ll create the Tornado configuration to send the script status on NetEye and monitor your scheduled jobs.
These Solutions are Engineered by Humans
Did you find this article interesting? Are you an “under the hood” kind of person? We’re really big on automation and we’re always looking for people in a similar vein to fill roles like this one as well as other roles here at Würth Phoenix.
Paolo Seghetti
Author
Latest posts by Paolo Seghetti
30. 06. 2026
Azure, Cloud, Microsoft, NetEye, NetEye Extension Packs, Unified Monitoring
New NEP Coming Soon: Monitor Your Office 365 Tenant Subscriptions with Confidence
22. 05. 2026
AI, NetEye, Unified Monitoring
An AI Approach for Old SNMP Devices
30. 03. 2026
NetEye, Unified Monitoring
SNMP and Non-connected Interfaces
28. 12. 2025
Automation, Business Service Monitoring, Icinga Web 2, NetEye, Service Management
Automating Notifications in NetEye
30. 09. 2025
NetEye, Unified Monitoring
Business Process Automation on NetEye