30. 06. 2026
Azure, Cloud, Microsoft, NetEye, NetEye Extension Packs, Unified Monitoring

23. 12. 2015
Juergen Vigna
NetEye, Unified Monitoring
End User Experience Monitoring of Web Application with Sahi
Alyvix, our end user monitoring engine, can be used on any Application, web-browsers included. For Web Applications instead, we use the tool Sahi and for bigger infrastructures SahiPro. These tools are much more performant then Alyvix because they can work inside the DOM of the web-browser. Therefore, they are not dependent on screen images to control the applications.
This also means that a single Sahi server is able to execute a lot of different web navigations at a time, while Alyvix, as it depends on the “Virtual Eye (over screenshots)”, is able to execute just one navigation at a time. Lately, I implemented SahiPro in a bigger Enterprise, where we are now executing over 300 navigations every 5 Minutes, using 3 different SahiPro server processes at a time. Two of the processes are running on a NetEye server in parallel, to load balance. A third SahiPro installation on a Windows Server is needed as some navigations have to be done by the Internet Explorer which is available only on Windows Platform.
When executing the check on your NetEye/Nagios server you then see if your web application is working over the exitcode of the plugin, you see how good the web application is performing over time over the performance data and graphs:
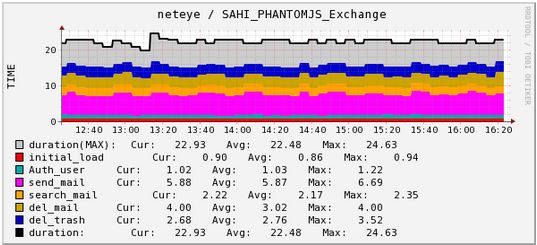
SahiPro Navigation Performance Graph
And more you see also the detailed html-log of SahiPro with the “Last Navigation Image” included.
Nagios Service Output
And this is an example when you click on the “Log” URL in the Plugin Output:
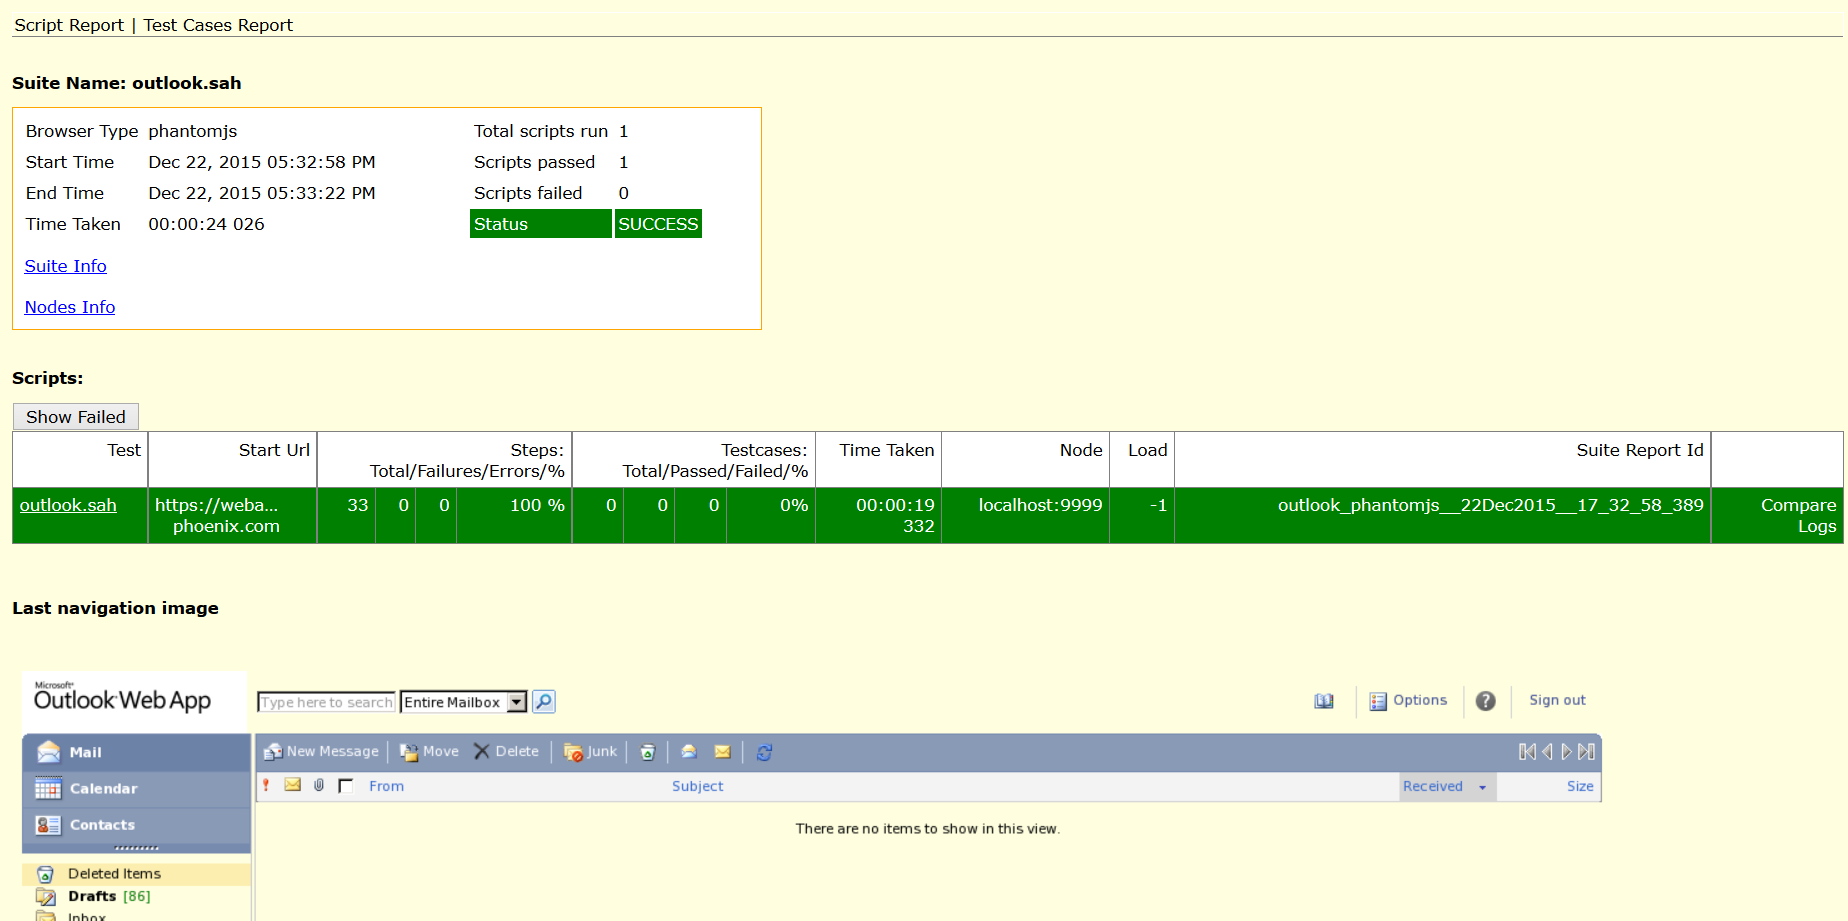
SahiPro HTML Report with “Last Navigation Image”
Use this Nagios plugin for executing Sahi Navigations you just need a Sahi(Pro) server setup to be able to use this plugin.
Enjoy the Control over your Web Applications.

Juergen Vigna
NetEye Solution Architect at Würth IT Italy
I have over 20 years of experience in the IT branch. After first experiences in the field of software development for public transport companies, I finally decided to join the young and growing team of Würth Phoenix (now Würth IT Italy). Initially, I was responsible for the internal Linux/Unix infrastructure and the management of CVS software. Afterwards, my main challenge was to establish the meanwhile well-known IT System Management Solution WÜRTHPHOENIX NetEye. As a Product Manager I started building NetEye from scratch, analyzing existing open source models, extending and finally joining them into one single powerful solution. After that, my job turned into a passion: Constant developments, customer installations and support became a matter of personal. Today I use my knowledge as a NetEye Senior Consultant as well as NetEye Solution Architect at Würth Phoenix.
Author
Latest posts by Juergen Vigna
22. 05. 2025
NetEye, Unified Monitoring
Automatic Integration of NagVis Map into Icinga Web 2/NetEye Monitoring