30. 06. 2026
Azure, Cloud, Microsoft, NetEye, NetEye Extension Packs, Unified Monitoring

The most significant enhancements of the latest NetEye version regard the area of Business Service Monitoring. Moreover, the IT Operations Analytics module based on InfluxDB and Grafana is now integrated to the standard delivery of NetEye.
Business Service Management
Business Service Management creates the connection between the single components of an IT infrastructure and the higher-ranked business-critical IT services. In NetEye, the availability calculation for business services is based on monitoring data from the underlying services and components.
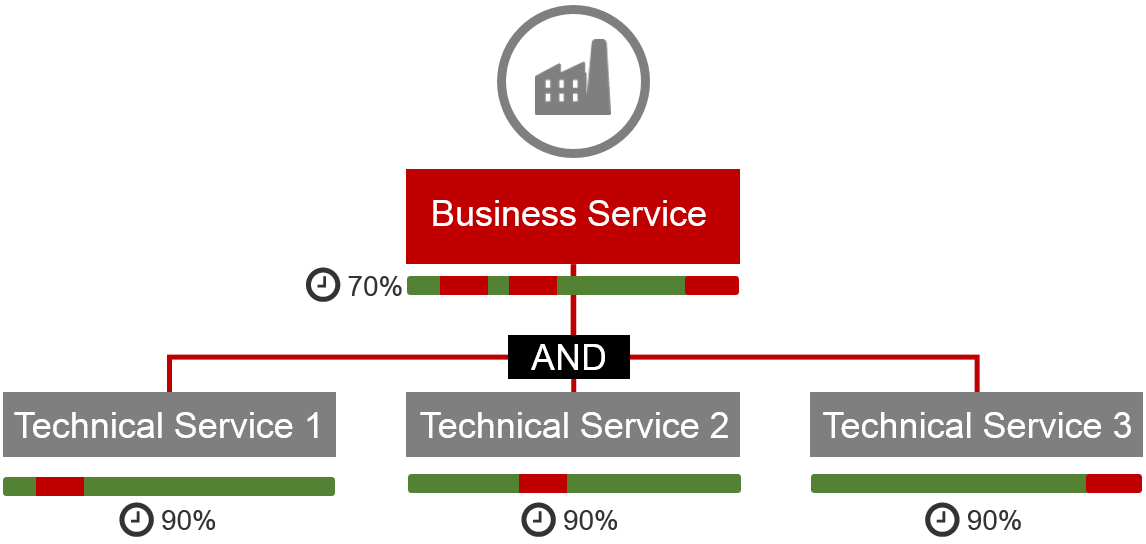
The availability of a business service depends on the availability of the underlying technological components as hardware, software, databases etc. In case each component is not available for 10% of the time (periods highlighted in red), the entire business service suffers a downtime of 30%, since the correct operation of all components is necessary.
Availability measurement for business services based on historical data
The versioning of business services becomes possible through a new data structure in NetEye 3.9. In this way, historical availability data can be used to calculate SLA compliance of changing business services. Furthermore, for each configuration change the username and timestamp are recoded, to satisfy auditing requirements.
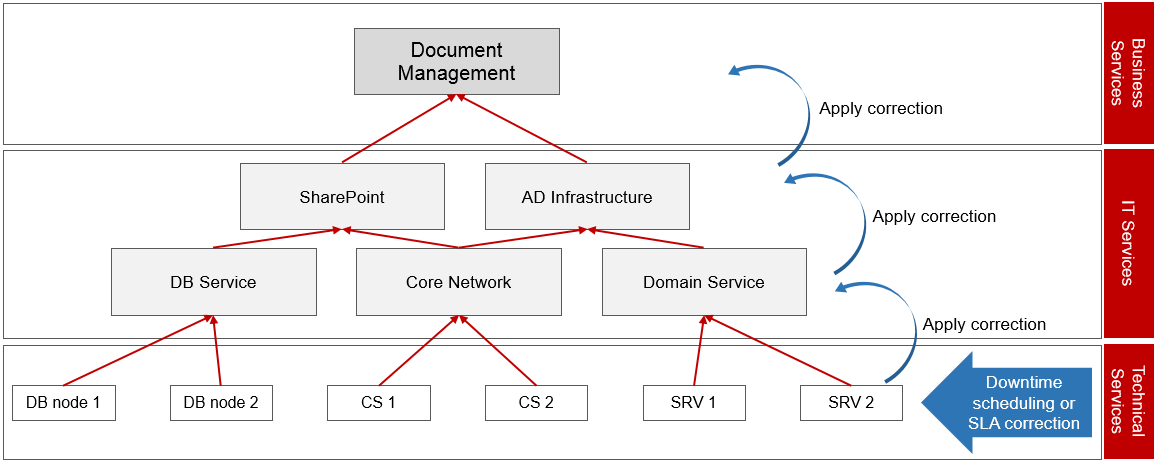
Application of SLA corrections on infrastructure components to superior business services
In NetEye 3.9, corrections on the availability data on the technical level are passed on to the business service level. In addition, also downtimes for maintenance are passed on to the superior services.
IT Operation Analytics
Since the release of NetEye 3.8, it was possible to activate, InfluxDB and Grafana on customer request. The by default integration of InfluxDB and Grafana in NetEye 3.9 now provides the possibility to centrally illustrate and analyze all collected performance data, to all NetEye customers.
Time-oriented representation of performance data
With the new approach, the barrier among different datasets is removed by storing the information in a homogenous time series database (TSDB). The benefit of this is, that a plurality of performance data from different systems for a certain time span can be graphically visualized and evaluated in a few moments.
The time-oriented representation of performance data is done by the database InfluxDB. In this way, data can now be stored in NetEye with different resolutions and retention times.
Visual comparison for trend recognition
Grafana provides the frontend for graphical representation. With it it is possible to define search queries and to generate the corresponding graphs.
The integration of InfluxDB and Grafana is designed for the recognition of trends within large da-ta sets. The powerful database provides data within milliseconds after they are captured, whereby it pro-vides the requirements for real time analysis. Patterns, trends, deviations and evolutions can be recog-nized through the comparison of historical data.
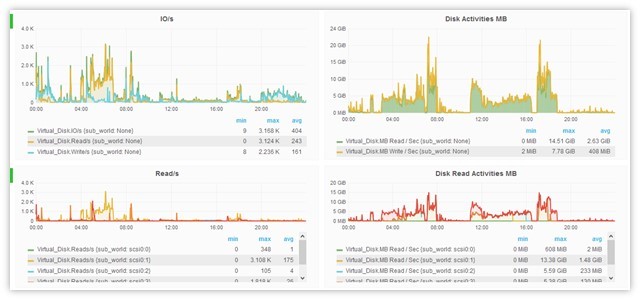
Application example:
Since data from various checks can be stored centrally within a single database, all these data can also be illustrated on uniform charts. This allows, for example, to illustrate and compare the same metric for different systems (expl. CPU-load).
Moreover, one metric of one system of a certain period can be compared to the same metric of the same system of another period.
The single components can be analysed, by zooming in. This may be of special interest, for example, in case of troubleshooting on a database server where processor load, read/s, wirte/s, the hit rate on the database cache, transaction runtime etc. have to be analyzed.
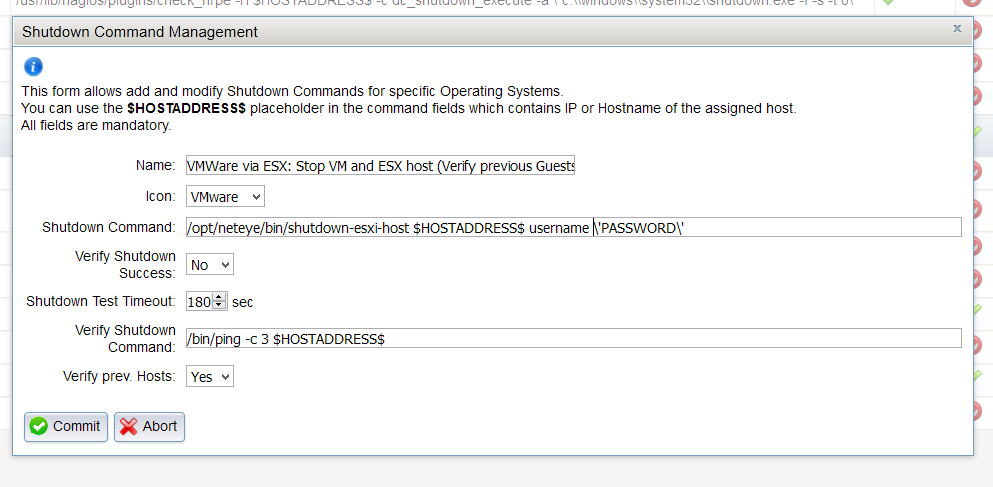
Shutdown Management
Configuration from the graphical user interface
In NetEye 3.9 shutdown commands can be managed directly from the graphical user interface. Sequence changes in the shutdown procedure can also be quickly handled through the GUI.
Moreover, standard configurations for additional device models have been added.
End User Experience Monitoring
New installation package to integrate Alyvix in NetEye
A new installation package allows all NetEye customers to easily and independently integrate the open source end-to-end monitoring solution Alyvix to their NetEye. In this way, the performance data collected by Alyvix can be graphically represented in NetEye.
Alyvix is an open source software that tests the availability of applications and measures their performance. The engine interacts with the application-GUI and measures the single transaction times. The collected performance data can, as mentioned above, visualized in NetEye. This solution is primarily used to continuously measure the effective performance perceived by real users on business-critical applications, in different locations. Thanks to this integration into NetEye, possible service quality restrictions can trigger notifications. (www.alyvix.com)
System & Storage Monitoring
Automatic import of virtual machines
NetEye 3.9 allows to easily import all virtual machines of a VMware infrastructure. Alternatively, the hosts that need to be monitored can be selected from the complete host list. During the import, the predefined monitoring profile is automatically applied to each host.
During the import, NetEye lists the names and IP addresses of the virtual machines, to avoid the manual creation of hosts and to guarantee that no machine is overlooked.
New standard monitoring profiles for Microsoft servers
A set of basic profiles to monitor Microsoft servers is available in NetEye 3.9. These profiles contain targeted metrics to monitor the operating system and can be also applied to existing hosts with installed agents.
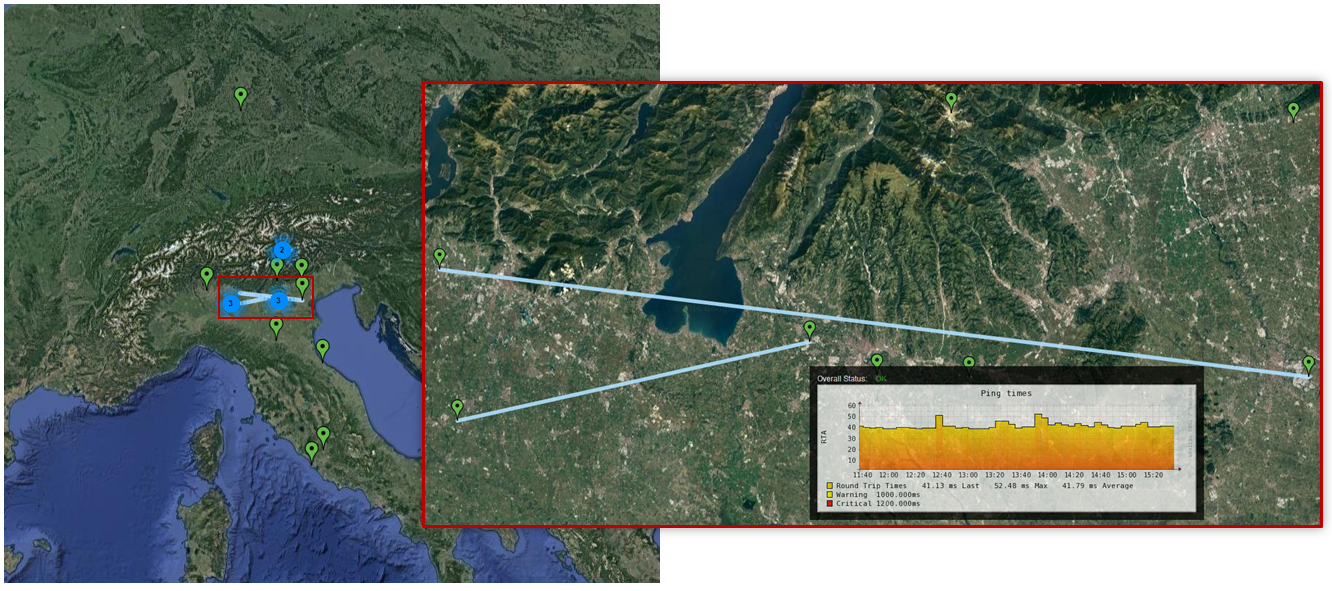
Cluster view of monitored devices
In the NagMap utility in NetEye 3.9 the visualization of monitoring results was improved, by automatically grouping devices to clusters. In this way, also the navigation to the single devices becomes much easier. The further the map is zoomed out, the more devices are grouped to one point.
General enhancements
- Upgrade to version 2 of the „Monitoring Plugins“ [www.monitoring-plugins.org]
- Installation packages for JAVA monitoring (via JAVA Management Extensions) are available on the NetEye repository.
NetEye 3.9 upgrade notes
The upgrade from NetEye 3.8 to NetEye 3.9 can be autonomously done on the basis of the documenta-tion provided in NetEye 3.8.
Step 1: Update of the documentation package in NetEye 3.8 through the following command: “yum –enablerepo=neteye update neteye-documentation”
Step 2: Execution of the upgrade procedure described in the updated documentation.
The autonomous upgrade will still be possible for all future NetEye minor releases. The requirement for this is a NetEye installation based on CentOS 6 (NetEye 3.6 and higher).

Patrick Zambelli
Project Manager at Würth IT Italy
After my graduation in Applied Computer Science at the Free University of Bolzano I decided to start my professional career outside the province. With a bit of good timing and good luck I went into the booming IT-Dept. of Geox in the shoe district of Montebelluna, where I realized how a big IT infrastructure has to grow and adapt to quickly changing requirements. During this experience I had also the nice possibility to travel the world, while setting up the various production and retail areas of this company. Arrived at Würth Phoenix (now Würth IT Italy) I started developing on our monitoring solution NetEye. Today, in my position as Consulting an Project Manager I am continuously heading to implement our solutions to meet the expectation of your enterprise customers.
Author
Latest posts by Patrick Zambelli
16. 01. 2024
NetEye, Unified Monitoring
Icinga 2 DSL for Defining the Monitoring Status of Objects with Director
23. 12. 2020
NetEye
Tornado – Getting in Action with Sample Rules
05. 05. 2020
NetEye, Unified Monitoring
Import Data Correlation and Automation with Icinga2 Director