30. 06. 2026
Azure, Cloud, Microsoft, NetEye, NetEye Extension Packs, Unified Monitoring

22. 12. 2023
Juergen Vigna
Log-SIEM, NetEye, Unified Monitoring
SIEM: Monitor Hosts Sending Data to Elasticsearch
Do you have a SIEM installation based on Elasticsearch (like the NetEye 4 SIEM Module) and are you sending data to it from your hosts? Then you’ll surely want to know whether your host is actually sending data, or if nothing is coming out at all. For this I made available a simple icinga/nagios plugin to check if data based on your search parameters is located within an Elasticsearch Index.
You can download the plugin from my GIT Plugins Repository: https://raw.githubusercontent.com/WuerthPhoenix/JUVI-NetEye-Monitoring-Plugins/main/check_elasticsearch_query
# /neteye/shared/monitoring/plugins/check_elasticsearch_query --help
Check a count of number of events fount in elasticsearch over a query and timeframe
Usage:  [-H <host>] [-p <port>] -q <query> [-t <timeframe>] [-w <count>] [-c <count>] [-L]
  -h, --help    : this help
  -V, --version : program version
  -H, --host    : host/address of elasticsearch (default: elasticsearch.neteyelocal)
  -p, --port    : tcp port of elasticsearch (default: 9200)
  -i, --index   : elasticsearch index name (default: logstash-*)
  -q, --query   : elasticsearch query string
  -t, --time    : timeframe for search from now back f.ex. 1h or 1d (default: 1h)
  -w, --warning : warning count  (default: not checked)
  -c, --critical: critical count (default: not checked)
  -L, --checkforless: check critical/warning for <= instead for >= which is the default
  -C, --curlcmd : The CURL command to use to connect to elasticsearch (default: /usr/share/neteye/elasticsearch/scripts/es_curl.sh)
                  f.ex.: /usr/bin/curl -E 'ES_CERT_PEM' --key 'ES_CERT_KEY'

check_elasticsearch_query -  - Copyright Juergen Vigna - Wuerth Phoenix srl.

This Monitoring plugin comes with no warranty. You can use and distribute it
under terms of the GNU General Public License Version 2 (GPL V2) or later.
As you can see from the above help, the default parameters are set so that they work on a NetEye SIEM installation, otherwise you’ll have to change the parameters for your ELK installation. An important note is that the -q parameter for the query is just a filter, so you can use for instance host.name: $host.name$ in your Icinga configuration.
Another important thing is that you may check if there are too many or too few entries for this host using the -L flag.
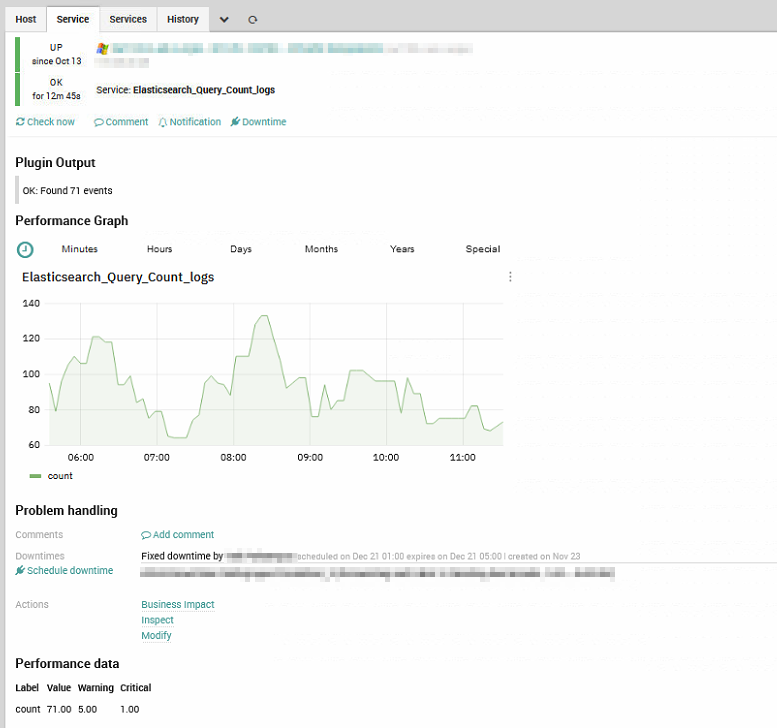
The above image shows a typical usage of this plugin to check if a host is still writing data to your Elasticsearch Database using the filter host.name: $host.name. Obviously if the host is not sending data permanently you’ll have to set the Time filter too so that you can be sure it will write data at least once a day (you can change it later to once a day).
Make your SIEM installation more stable using this approach.
These Solutions are Engineered by Humans
Did you find this article interesting? Does it match your skill set? Our customers often present us with problems that need customized solutions. In fact, we’re currently hiring for roles just like this and others here at Würth Phoenix.

Juergen Vigna
NetEye Solution Architect at Würth IT Italy
I have over 20 years of experience in the IT branch. After first experiences in the field of software development for public transport companies, I finally decided to join the young and growing team of Würth Phoenix (now Würth IT Italy). Initially, I was responsible for the internal Linux/Unix infrastructure and the management of CVS software. Afterwards, my main challenge was to establish the meanwhile well-known IT System Management Solution WÜRTHPHOENIX NetEye. As a Product Manager I started building NetEye from scratch, analyzing existing open source models, extending and finally joining them into one single powerful solution. After that, my job turned into a passion: Constant developments, customer installations and support became a matter of personal. Today I use my knowledge as a NetEye Senior Consultant as well as NetEye Solution Architect at Würth Phoenix.
Author
Latest posts by Juergen Vigna
22. 05. 2025
NetEye, Unified Monitoring
Automatic Integration of NagVis Map into Icinga Web 2/NetEye Monitoring