
10. 12. 2019
Luca Franzoi
Downloads / Release Notes, ITOA, NetEye, Unified Monitoring
Grafana User Management Deprecation in NetEye 4.10
A manual user configuration migration is required before upgrading to 4.10.
Starting in version 4.9, NetEye supports Grafana user management, which is completely integrated into NetEye via its existing roles mechanism. NetEye administrators can create new roles that map to Grafana roles (admin, editor or viewer) at the level of organizations and teams. NetEye users must then be assigned these roles in NetEye’s own module permissions (one NetEye role for each Grafana organization).
The process of changing to this new permissions scheme is not done automatically. Indeed, you can choose the best moment to migrate before an eventual upgrade to NetEye 4.10, when the new permission schema will be mandatory.
Before migrating, you will need to prepare by creating roles in NetEye, and assigning organizations and users. You can then mark the checkbox in the Analytics module’s configuration tab to start the migration process. The new scheme will be applied for each user individually when that user logs in for the first time after migration is completed. There is no way to roll back once the whole procedure has been successfully completed.
If you have defined some users and specific roles or teams in Grafana User Management, follow these steps to migrate your configuration:
- Check your Grafana configuration
- Make sure that “icinga2-influxdb” is added as a data source to your Main Organization (the organization with ID 1)
- Log in to NetEye with a Grafana Administrator user.
- Go to “ITOA”
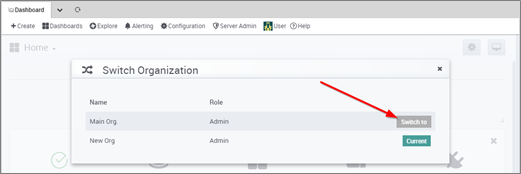
- Select User >> Switch Current Org (if present) >> Select “Main Org.” :
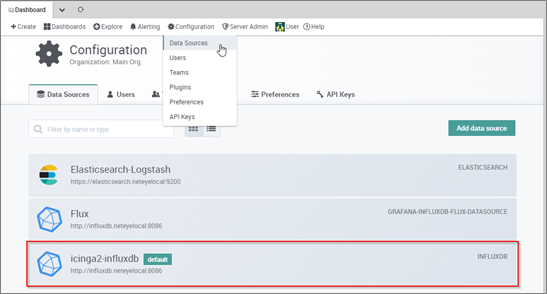
- Go to Configuration >> Data Sources
- Icinga2-influxdb should be there:
- Make sure that before you configure a NetEye role for an Organization, that Organization has already been added in Grafana.
- You can find all existing Grafana Organizations at Server Admin >> Orgs:
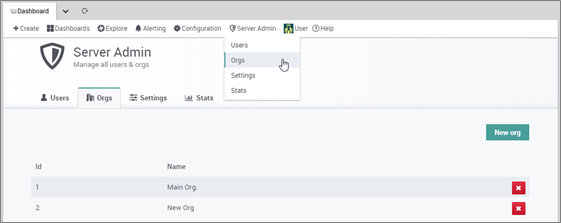
- You can find all existing Grafana Organizations at Server Admin >> Orgs:
- Make sure that “icinga2-influxdb” is added as a data source to your Main Organization (the organization with ID 1)
- Create NetEye roles at Configuration >> Authentication as described in the user guide under Monitoring basics >> User Authentication and Permissions >> Roles
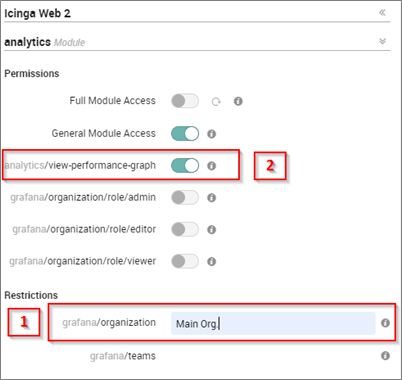
- Be completely sure that the organization string matches the Grafana role name (note that there is no string validator) – See [1] in image below
- Make sure that you have replicated exactly the same users/organizations and users/teams relations in the NetEye Analytics permissions configuration
- Make sure that the toggle switch View performance Graph in the NetEye role definition is enabled – See [2] in image below
- Finalizing the configuration. Warning: no roll back will be possible after this step.
- Enable the flag Apply new permission scheme in the Analytics module configuration tab (Configuration >> Modules >> analytics >> Configuration)
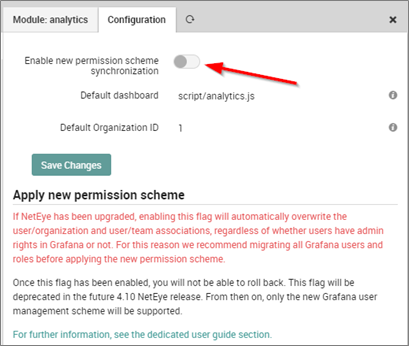
- Log out and then log back in so that the necessary changes will take effect
- Enable the flag Apply new permission scheme in the Analytics module configuration tab (Configuration >> Modules >> analytics >> Configuration)
If you need further information, or experience some problem migrating the configuration, feel free to contact our support team using one of the following options:
- net.support@wuerth-phoenix.com
- https://servicedesk.wuerth-phoenix.com/
- 0471 564101

Luca Franzoi
Service & Support Engineer at Würth IT Italy
Author
Latest posts by Luca Franzoi
03. 12. 2025
Front-end, Icinga Web 2, UX
Introducing a New Monitoring Interface: A Fresh, Flexible Experience
05. 05. 2025
Unified Monitoring
How to Reduce Icinga 2 Log Verbosity, and Regularly Clean Them from Event Viewer
05. 02. 2025
AI
Will AI Take Over the World?
13. 03. 2020
Bug Fixes, Log Management, Log-SIEM, NetEye, Unified Monitoring
Bug discovered on NetEye module logmanagement and SIEM