
15. 02. 2023
Giovanni Davide Saccá
NetEye, Unified Monitoring
Grafana: InfluxDB Query to Extract More Than a Single Metric in a Single Panel
A particular client who operates as an ISP for its customers and corporate departments requested the ability to summarize and display, in convenient graphs, a few metrics related to the bandwidth delivered on switch ports, where the available gateways provide connectivity.
The first activity I undertook was to obtain the MIB files and OIDs from the vendor in order to query, via SNMP, the desired metrics; the second task was to develop an ad hoc script to be able to extract useful metrics.
This tailor-made solution made it possible to configure service checks on board NetEye’s Director, and begin storing the metrics’ historical data in InfluxDB.
Here’s the output of the script execution with the metrics collected:
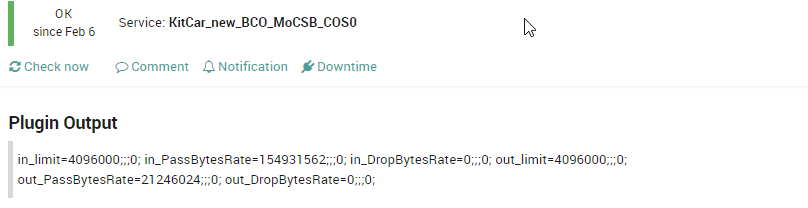
As you can see, the customer has provided a group name for each connectivity type that identifies it, and which for convenience has been adopted and included as a naming convention in the service name; this allows the customer to check at a glance the bandwidth status for the metrics involved, and more importantly to identify the limit value traceable to the CAR (Committed Access Rate) assigned to the individual customer.
Additional information about CAR is provided at this link:
This allows you to limit traffic based on certain matching criteria, such as incoming interface, IP precedence, or IP access list.
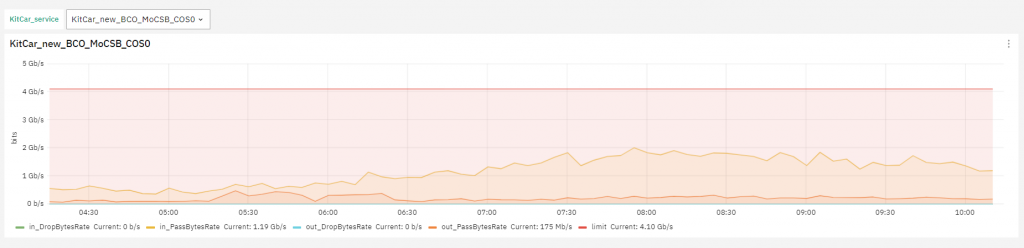
At this point it’s easy to see that there’s an interest in knowing when the client reaches their bandwidth limit, with a corresponding increase in Drop metrics.
But let’s proceed to identify how, once you have the necessary metrics in your database, you should proceed to make the panel showing individual connectivity, and how to make a Grafana Dashboard capable of extracting the same metrics of connectivity for all upstream paths being monitored.
The dashboard looks like this:
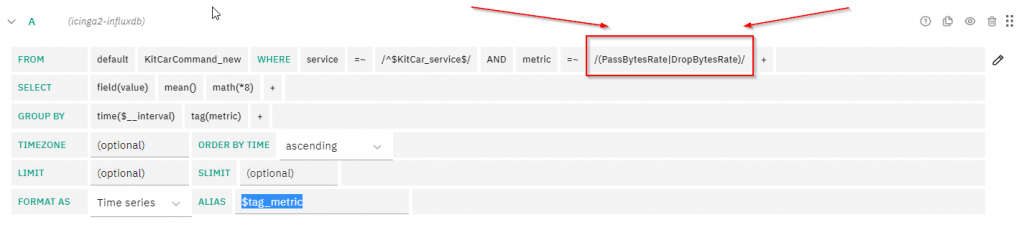
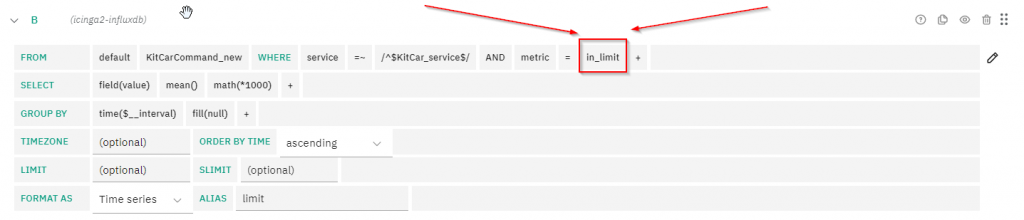
| (pipe) character allows both metrics to be inserted into the panel, while as for the limit (CAR) metric, a second query must be formulated that extracts the data from a database.As usual, it’s necessary to configure within Grafana the DataSource that will be used as the base with which you can execute useful queries, in this case icinga2-influxdb.
These Solutions are Engineered by Humans
Are you passionate about performance metrics or other modern IT challenges? Do you have the experience to drive solutions like the one above? Our customers often present us with problems that need customized solutions. In fact, we’re currently hiring for roles just like this as well as other roles here at Würth Phoenix.

Giovanni Davide Saccá
Hi all, my name is Davide and I was born in San Donato Milanese. Since I was a boy I've always been intrigued by PCs, and so I took my first steps with my Commodore VIC-20. Before joining Würth Phoenix as an SI consultant, I worked first as a Network Engineer for several ISPs (Internet Service Providers) in the late 90s, then for the first ASP (Application Service Provider) and next as a head of IT Network and Security. My various ITIL and Vendor certifications have allowed me to be able to cooperate at multiple project levels. I like tennis, music, motorcycles and going on nature walks with my family.
Author

Latest posts by Giovanni Davide Saccá
15. 02. 2023
Unified Monitoring
NetEye GeoMap Module
15. 02. 2023
Unified Monitoring
Ntopng and Behavior Analysis