
NagVis is a visualization add-on for NetEye, and can be used to show NetEye monitoring data, over for example, a Network Schema as the use case below will show you.
Thanks to NagVis, you can import a previously created network schema into NetEye, and overlay network objects that have previously been monitored by NetEye.
Let’s start by describing how to proceed with the configuration of the NagVis module within NetEye.
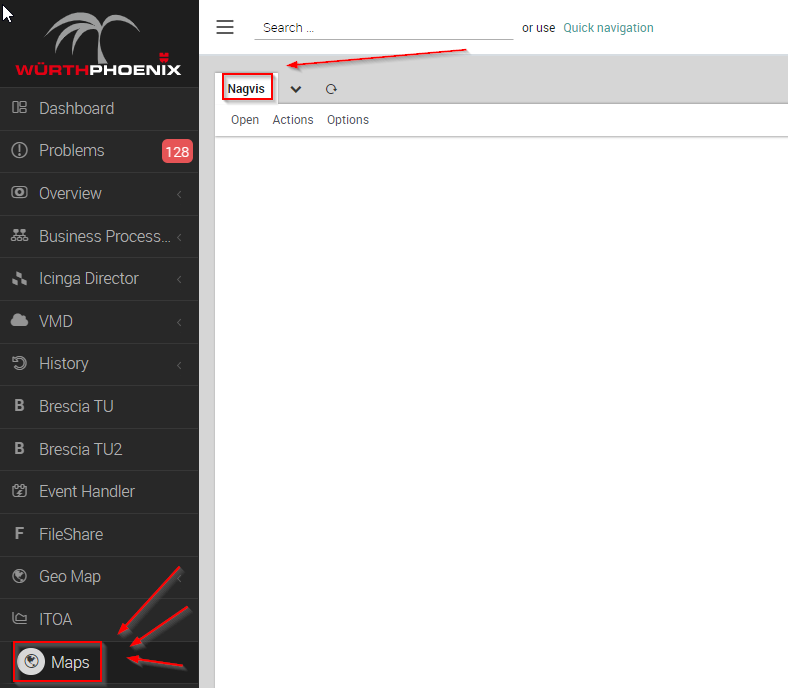
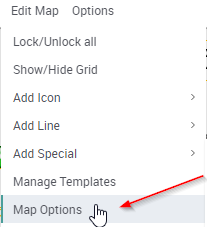
The NagVis module can be accessed via the main menu, as shown in this picture:
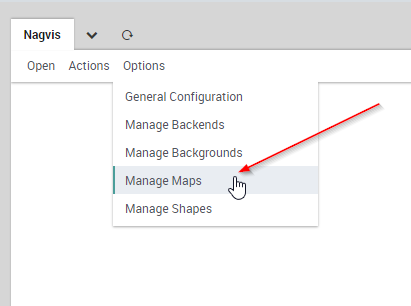
To create the map, go to Options > Manage Maps
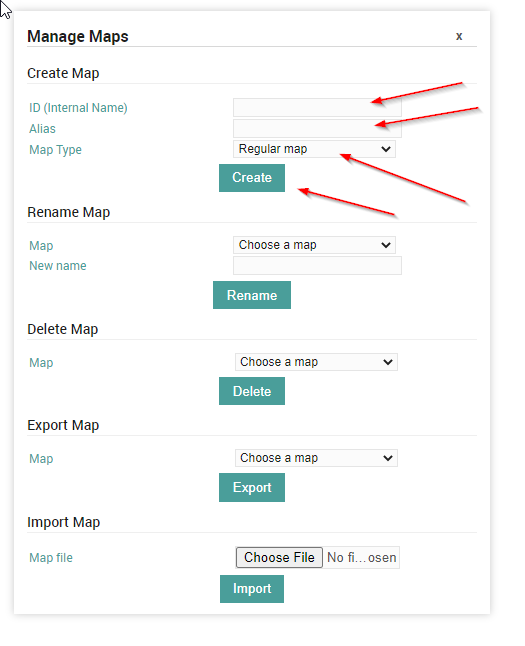
Now under Create Map give the map a name, for example mymap, and an alias like My Map. For the Map Type select Regular map and launch it with Create button
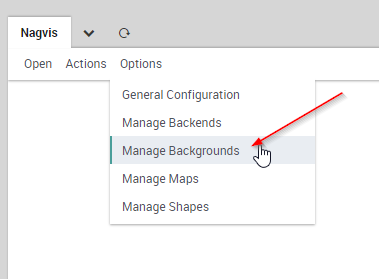
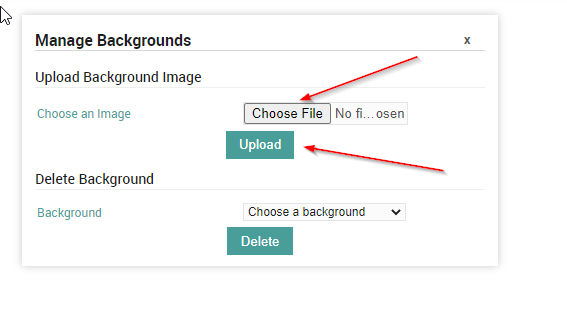
Next, import the Network Schema you want to monitor as the background image – this is achieved using Options > Manage Backgrounds. Simply select the local file and start the image upload with the Upload button
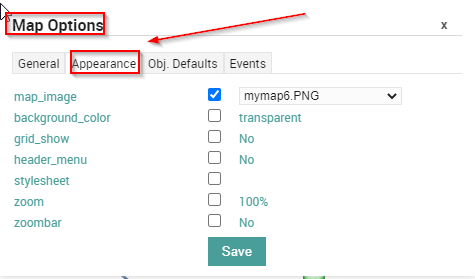
Now we need to define the imported image as the background for the current map. Call up the map options with Edit Map > Map Options and go to the Appearance tab. Here activate the map_image option and select the desired image from the dropdown menu. Don’t save it just yet, we will need a setting for the maps options.
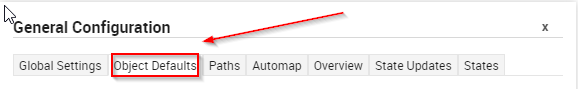
Go to the Obj. Defaults tab. Here you can activate the label_show option. This option enables the host and service icons on the map to be labelled with their appropriate host/service names – otherwise the icons can only be identified via their hover-menus. Finally, save these settings.
In my case, since the network diagram is associated with many devices, and the labels would not be properly displayed on the network diagram, I decided not to enable the label option, but if you need to you can activate it:

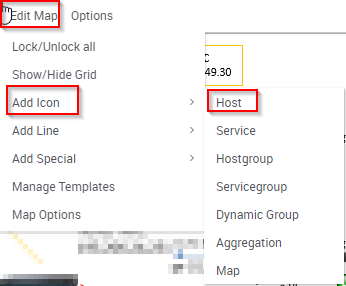
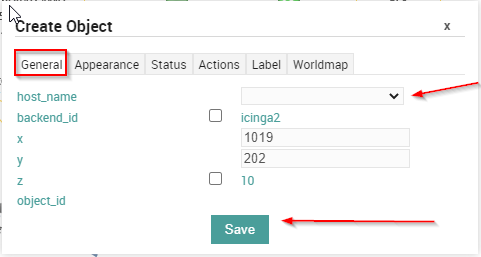
Now it’s time to add the host. Click on Edit Map > Add Icon > host and then place the cursor (which now appears as a cross) at the position on the map where the icon is – at this point the Create Object-dialogue will open. In the General tab simply select the desired host from the dropdown menu in host_name and save.
Remember that you’ll need to activate edit mode to be able to move or edit an icon. Right-click on the icon to open its context menu, and select Unlock.
These Solutions are Engineered by Humans
Did you read this article because you’re knowledgeable about networking? Do you have the skills necessary to manage networks? We’re currently hiring for roles like this as well as other roles here at Würth Phoenix.
Giovanni Davide Saccá
Hi all, my name is Davide and I was born in San Donato Milanese. Since I was a boy I've always been intrigued by PCs, and so I took my first steps with my Commodore VIC-20. Before joining Würth Phoenix as an SI consultant, I worked first as a Network Engineer for several ISPs (Internet Service Providers) in the late 90s, then for the first ASP (Application Service Provider) and next as a head of IT Network and Security. My various ITIL and Vendor certifications have allowed me to be able to cooperate at multiple project levels. I like tennis, music, motorcycles and going on nature walks with my family.
Author
Latest posts by Giovanni Davide Saccá
15. 02. 2023
Unified Monitoring
NetEye GeoMap Module
15. 02. 2023
Unified Monitoring
Ntopng and Behavior Analysis
15. 02. 2023
NetEye, Unified Monitoring
Grafana: InfluxDB Query to Extract More Than a Single Metric in a Single Panel