
06. 07. 2009
Unified Monitoring

30. 09. 2026
Rocco Pezzani
NetEye, Unified Monitoring
Automatic Discovery of Monitoring Objects using NetEye Cloud
Today, I’d like to share some exciting news about the latest feature we’re about to introduce to NetEye Cloud. As the title suggests, the Automatic Discovery of Monitoring Objects feature is now ready for rollout and will be made generally available to all NetEye Cloud customers within the next few weeks, if not days. In the near future, this functionality will be available to every customer, making it easier than ever to keep monitoring configurations up to date and consistent. So let’s take a closer look at what this feature is, how it works, and how you can enable it.
What is Automatic Discovery of Monitoring Objects?
Automatic Discovery of Monitoring Objects, hereafter referred to as Autodiscovery, is a collection of technologies used by NetEye Cloud to automatically identify and monitor the subsystems and components of a monitored host that also require monitoring. The discovery and monitoring processes are fully automated and driven by a set of general configuration rules, which can be further customized at the individual host level. NetEye Cloud continuously evaluates the status of each monitored host to ensure that all relevant components are monitored and that obsolete monitoring objects are removed when no longer needed.
In practical terms, NetEye Cloud checks the status of each monitored host every hour and automatically creates or removes the required Service Objects as needed. This provides a convenient and efficient way to keep monitoring configurations aligned with the actual state of your infrastructure, without having to manually identify additional components or request the creation and removal of Service Objects through our Onboarding and Support teams.
Once a Service Object has been created, it can be freely customized according to your specific monitoring requirements. Autodiscovery focuses on identifying which objects should exist and does not overwrite user-defined configurations, ensuring that manual customizations remain intact.
What Kind of Elements Are Supported?
At the moment, Autodiscovery supports the detection of Windows Services and Volumes on both Windows Servers and Windows workstations. A variety of filtering options can be applied to ensure that only the components relevant to your environment are discovered and monitored.
For example, you can choose to discover all Windows Services configured with Automatic Startup, optionally including or excluding services based on specific name patterns. Similarly, you can restrict volume discovery to non-removable disk drives, avoiding the creation of monitoring objects for temporary or external storage devices.
We’re currently working on adding support for IIS-hosted websites. This requires a more sophisticated implementation because, unlike Services and Volumes, website discovery will also involve the automatic creation of Host Objects within the customer’s monitoring perimeter. As a result, the feature requires extensive testing before release. However, we expect it to become generally available very soon.
We are aware that the current list of supported elements is still relatively limited. However, the underlying architecture has been designed with extensibility in mind, making it straightforward to add support for additional element types and operating systems. We therefore encourage customers to let us know which technologies they would like to see supported next through our Service Portal at the link here: Managed Service Provider – Raise a request – Jira Service Management. Your feedback helps us prioritize our development efforts and deliver the capabilities that provide the greatest value to our customers.
How Automatic Discovery of Monitoring Objects Works
The cornerstone of this feature is the Icinga 2 Agent, which is also its main prerequisite. For Autodiscovery to work, an Icinga 2 Agent must be installed on the monitored host. At first glance, this may appear to be a limitation. In practice, however, all hosts within a customer’s monitoring perimeter are already expected to run an Icinga 2 Agent, making the feature applicable to the vast majority of monitored systems.
Looking ahead, we plan to integrate additional asset data sources to extend discovery capabilities to systems where an Icinga 2 Agent cannot be installed. While this functionality is still under development, it’s already part of our roadmap. Another important aspect of Autodiscovery is maintainability. Users familiar with Icinga 2 may reasonably assume that such a feature requires dedicated discovery plugins to be deployed and maintained on every monitored host. The obvious question is therefore:
“Do I need to install and keep an additional set of plugins up to date on all my systems?”
The answer is simple:
“No, you don’t.”
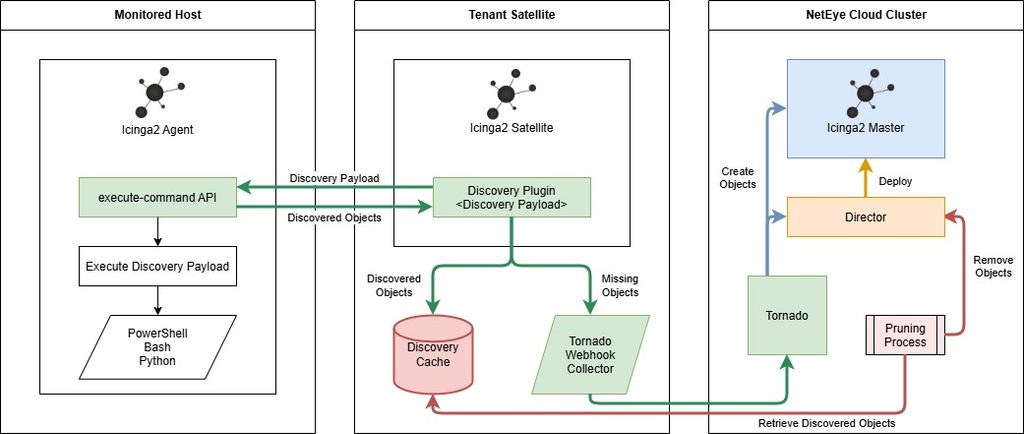
The discovery logic is executed by the NetEye Cloud Satellite rather than being permanently deployed on each monitored host. To achieve this, NetEye Cloud leverages the execute-command API provided by Icinga 2, which allows commands to be executed remotely through the Icinga infrastructure. Discovery payloads are injected on demand, executed by the Icinga 2 Agent, and removed without leaving any permanent components behind.
As a result, the only component that must be kept up to date is the NetEye Cloud Satellite itself, and its maintenance is fully managed by the NetEye Cloud team. This approach allows us to introduce new discovery capabilities, filters, and improvements transparently, without requiring any action from customers.
The Autodiscovery process starts on the NetEye Cloud Tenant Satellite, where the discovery plugins are deployed and maintained. Each discovery type corresponds to a dedicated Service Object on every monitored host where that specific discovery capability has been enabled. This also means that Autodiscovery can be activated selectively: Different discovery types can be enabled on different hosts according to operational requirements.
The discovery process is typically scheduled every hour and executed directly by the Satellite. Each discovery plugin contains a discovery payload, whose sole purpose is to identify all elements that should be monitored on the target system. Every execution generates a complete inventory of discoverable elements from scratch. The process is entirely stateless: no delta calculations are performed on the monitored host, and no temporary data is stored locally.
When a discovery cycle starts, the Satellite delivers the payload and its configuration to the Icinga 2 Agent through the execute-command API. The Agent executes the payload and returns the resulting list of discovered objects. The discovery plugin then parses this information, identifies any missing monitoring objects, and forwards them to Tornado through the Webhook Collector for automatic creation.
At the same time, the complete list of discovered objects is stored in a cache to be used later by the pruning process. Once Tornado receives the list of missing objects, the corresponding monitoring objects are created automatically. Since neither Tornado nor Icinga 2 support the immediate removal of monitoring objects during this workflow, a dedicated pruning process is executed regularly.
The pruning process retrieves the expected state of all discovered objects from the Satellite, identifies objects that are no longer present in the monitored environment, and removes them from Director. The subsequent scheduled deployment then propagates the updated configuration across the entire NetEye Cloud infrastructure. It’s important to note that the pruning process is aware of the origin of each object. Only Host Objects and Service Objects created by Autodiscovery are eligible for automatic removal. Objects created manually or through other mechanisms are never affected, even if they match elements that are no longer discovered.
The diagram below illustrates the complete workflow. The green flow represents object discovery, blue represents object creation, red represents object deletion through pruning, and yellow represents configuration deployment across the monitoring infrastructure.
How Can Customers Enable Autodiscovery?
Although Autodiscovery is available generally, it is not enabled by default. Since the feature can automatically create additional monitoring objects which may result in increased service costs, we want to ensure that customers explicitly choose to activate it. To do that, simply open a ticket through the Support Portal at the link Managed Service Provider – Raise a request – Jira Service Management and our team will take care of the activation process.
If you’d like to discover and monitor a type of element that’s not currently supported by Autodiscovery, we encourage you to contact your onboarding specialist or open a ticket through the Support Portal at the link Managed Service Provider – Raise a request – Jira Service Management. We’re always interested in understanding our customers’ needs and will be happy to discuss new discovery capabilities and evaluate their inclusion in our roadmap.
Author

Latest posts by Rocco Pezzani
22. 05. 2026
NetEye, NetEye Extension Packs
NEP and Upgrading to NetEye 4.48
18. 03. 2025
Icinga Web 2, ITOA, NetEye, UI, Unified Monitoring
A First Step towards Multitenancy in Icinga 2
31. 12. 2024
Business Service Monitoring, ITOA, NetEye, SLM, Unified Monitoring
Display a Service’s Availability with ITOA
30. 11. 2024
Business Service Monitoring, NetEye, Unified Monitoring
The Story of a Strange Business Process