21. 05. 2026
APM, Kubernetes

Tornado is a core NetEye component for event management. To ensure Tornado processes events and triggers the expected actions, you should monitor both service availability and its behavior under load.
This article explains how to collect Tornado performance data with OpenTelemetry (OTel), send it to Elastic APM, and view it in Kibana in the NetEye environment.
Why Monitor Performance?
Tornado receives events, processes them according to the Processing Tree, and triggers the actions defined by the rules. It’s therefore an important component in NetEye’s monitoring workflows and event management. For more details, see the Tornado documentation in the NetEye User Guide.
Tornado can process high volumes of events. However, if the workload exceeds the available resources, a gap may emerge between the number of events received and the number processed. Performance monitoring helps identify potential bottlenecks, understand workload trends and support troubleshooting activities.
How to Monitor It: OpenTelemetry and Elastic APM
You can find Tornado’s OpenTelemetry configuration in /neteye/shared/tornado/conf/tornado.toml. Use this file to configure the parameters that Tornado needs to send performance data to Elastic APM.
Step 1: Create the Elastic APM integration
First, create and configure the Elastic APM integration that will receive the data. When configuring it, review the settings related to sampling, refer to Elastic’s documentation on transaction sampling, and select values that match the expected data volume and observability requirements.
Step 2: Configure Tornado
Edit the tornado.toml file by adding or updating the following configuration, replacing the example URL with the actual APM Server address reachable from the NetEye instance:
[logger.tracing_elastic_apm]
# Enables sending tracing data to Elastic APM.
# Valid values: true, false
apm_output = true

# Elastic APM Server URL
apm_server_url = "https://neteye:8200"

[logger.tracing_elastic_apm.exporter]
# Delay between consecutive exports, in milliseconds (default: 5000)
scheduled_delay_ms = 1000

# Maximum time allowed for an export, in milliseconds (default: 30000)
max_export_timeout_ms = 10000

# Maximum queue size (default: 65536)
max_queue_size = 1048576

# Maximum batch size; must be <= max_queue_size (default: 512)
max_export_batch_size = 2048
The values shown are examples and should be sized according to the available resources, event volume, and APM Server capacity. In particular:
- Export interval: Determines how often data is sent.
- Timeout: Sets the maximum duration of an export attempt.
- Queue size: Determines how much data can wait to be sent. Larger queues can absorb temporary spikes, but require more memory.
- Batch size: Controls how much data is sent at once. Larger batches may improve efficiency, but consume more resources.
It’s advisable to start with values suited to the environment, assess the impact on Tornado and the Elastic APM Server, and change one parameter at a time. Check for delays or incomplete exports after each change.
Verify the Results in Kibana
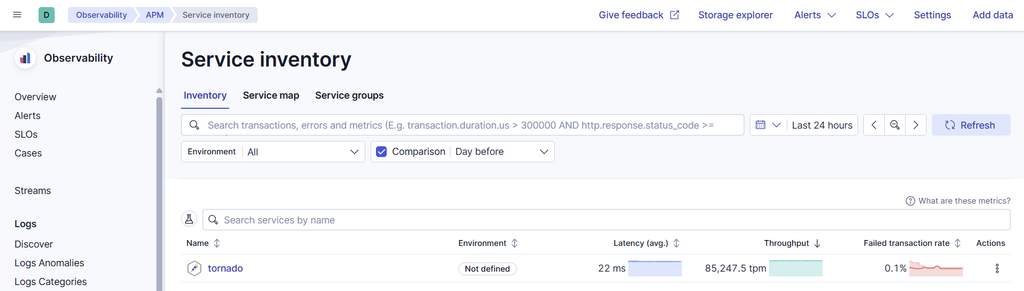
Once the data is available, open Kibana and go to Observability → Applications. Tornado should appear in the list of services. Then select the service and set the desired time range:
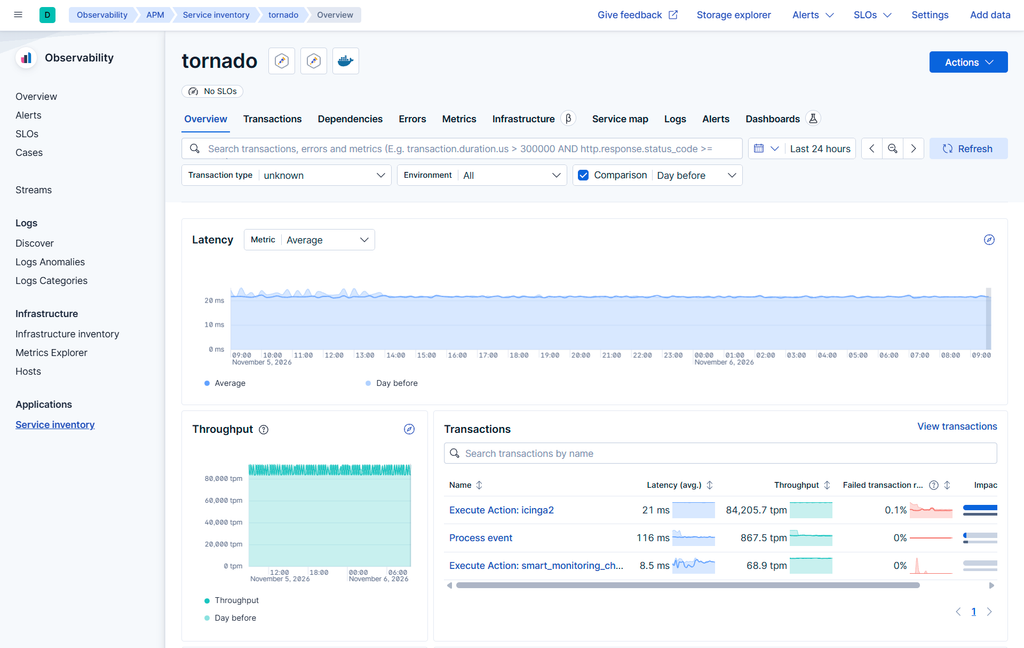
The view lets you explore the available performance data and see how it changes over time. You can then compare periods with different workloads and investigate intervals in which variations or anomalies occur:
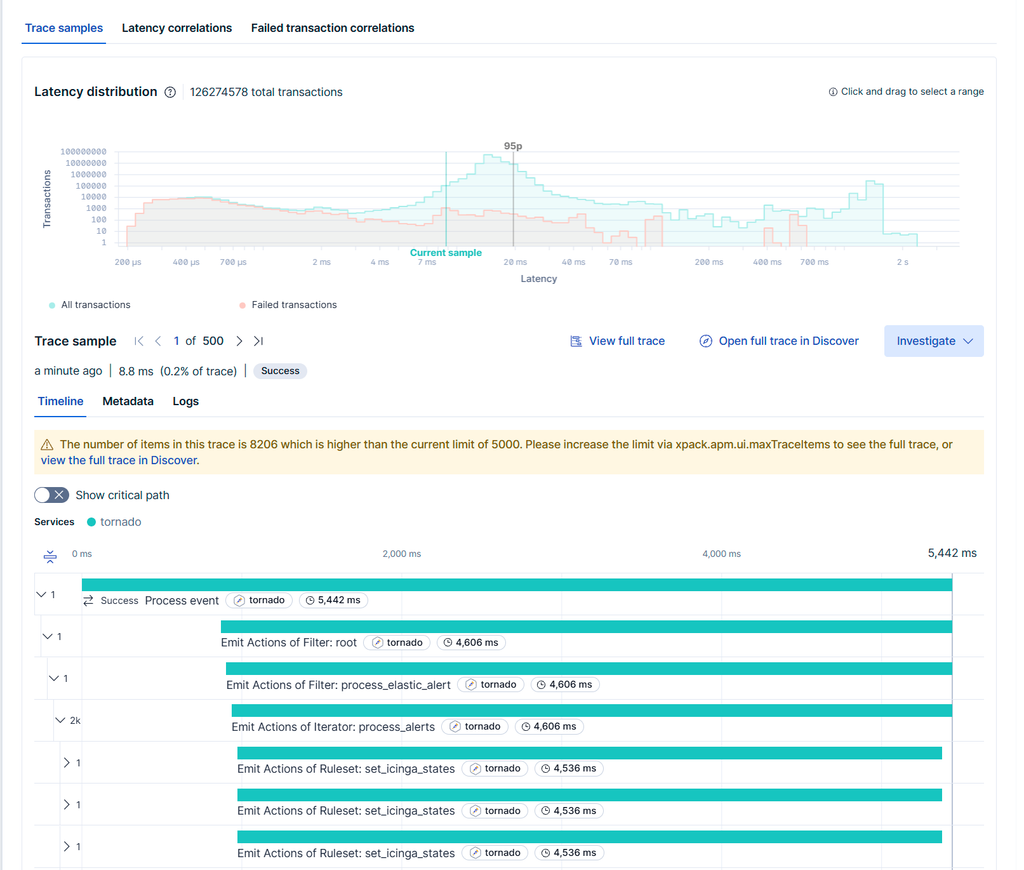
The Transactions section provides more detailed information about Tornado’s activity, including transaction latency and trace samples. Selecting a trace sample opens its timeline, where you can inspect the processing steps and their durations:
Conclusion
OpenTelemetry and Elastic APM make it possible to monitor Tornado’s performance and view the collected data directly in Kibana. The service view helps track how the engine behaves under changing workloads and provides a starting point for investigating potential anomalies.
To obtain useful results without overloading the system, configure sampling and the exporter in line with the available resources. You can then monitor both the quality of the collected data and its impact on the environment over time.
These Solutions are Engineered by Humans
Are you passionate about performance metrics or other modern IT challenges? Do you have the experience to drive solutions like the one above? Our customers often present us with problems that need customized solutions. In fact, we’re currently hiring for roles just like this as well as other roles here at Würth IT Italy.

Daniele Saccon
My journey in the world of IT began in the area of Data Analytics and Big Data, where I worked with a different tools, with a particular focus on Elastic Stack. Over time, my interests shifted toward Application Performance Monitoring and Observability, which now represent the core of my professional activity. I am passionate about making systems and data more readable, interpretable, and useful, in order to help customers make better decisions and gain an increasingly clear view of their technological environments.
At Würth IT Italy, I am part of the NetEye Delivery team, where I support customers on projects related to APM and Observability. What motivates me most is working across different contexts and having the opportunity to combine technical expertise with a consulting approach, building practical solutions that deliver real value.
Author

Latest posts by Daniele Saccon
10. 07. 2026
APM, Log Management, Log-SIEM
Creating Powerful and Effective Dashboards: Tips and Best Practices
16. 03. 2026
APM, Knowledge Management, Log-SIEM, Training
Inside Elastic Certifications: My Experience Between Preparation and Exams