30. 06. 2026
APM, DevOps, Kubernetes

21. 05. 2026
Francesco Penasa
APM, Kubernetes
Observability on OpenShift: A Case Study with Red Hat OpenTelemetry and eBPF
How we adapted our monitoring approach when the default choice didn’t fit
and what we learned along the way.
You’ve probably been there. You walk into a new observability project, playbook in hand, only to realize that no two projects are ever really the same. Every team has its own tools, its own platform quirks, and its own comfort zone. The real challenge is finding a way to make it all work together.
This is a story about one of those projects. We were tasked with bringing full APM visibility to a customer’s OpenShift cluster. Our usual approach hit a wall, forcing us to adapt and build a solution that taught us a few things about the importance of flexibility. It’s also a bit of a love letter to eBPF, but we’ll get to that.
What We Usually Do: EDOT
Normally when a client needs Kubernetes monitoring, our first recommendation is EDOT (Elastic Distribution of OpenTelemetry). We’ve used it extensively on AWS EKS, it works seamlessly with NetEye, and it provides a lean, out-of-the-box experience with traces, metrics, the whole Elastic Observability section, and pre-built dashboards all ready to go.
So, when the project kicked off, we naturally proposed EDOT. However, the customer was looking for a solution that aligned more closely with their existing Red Hat ecosystem.
Why They Went a Different Route
It wasn’t a matter of EDOT being a good or bad tool; it simply wasn’t the right fit for their environment.
This particular ops team wanted to manage their cluster as much as possible through OpenShift Operators, a powerful feature that automates the lifecycle of Kubernetes-native applications. They wanted official Red Hat support for all their tooling and were hesitant to deploy something unfamiliar on their cluster.
We pivoted to the Red Hat build of OpenTelemetry, which is Red Hat’s own supported distribution, neatly packaged as an OpenShift Operator. It checked all their boxes: Official support, Operator-based management, and a familiar deployment model. Problem solved.
Of course, it’s never that simple.
The Trade-offs (There Are Always Trade-offs)
By switching from our usual EDOT setup to the Red Hat build of OpenTelemetry Operator, we lost some of the nice integrations we were used to using. The Red Hat build is a more generic OpenTelemetry Collector with a smaller feature set, and it doesn’t come with the native Elastic processors and exporters that make correlation and enrichment smooth in EDOT.
The good news is that Elastic is fully OTLP-compatible, so getting the data in in the first place wasn’t an issue. The real challenge was that some integrated features, like the built-in Kubernetes dashboards and infrastructure inventory, just didn’t light up correctly. These dashboards rely on specific metadata that EDOT adds automatically. For example, a dashboard might expect the field kubernetes.pod.name when the standard OTLP pipeline sends k8s.pod.name.
This wasn’t a deal-breaker, just a bit of extra work. We solved this by building custom dashboards for OpenShift that could work with data from either Red Hat’s OTEL or EDOT. It took more effort upfront, but the result was not only satisfying, it also created a future-proof model for other OpenShift projects.
However, the bigger gap we faced was the lack of eBPF instrumentation out of the box. And for this project, we really wanted eBPF.
Why We Care So Much About eBPF
If you’re new to eBPF, it’s a technology that is fundamentally changing observability. Instead of adding agents or SDKs to your application code, eBPF hooks directly into the Linux kernel, in the so-called “Kernel hooks”. This allows it to observe everything happening at the system level without a single code change (that’s our favorite part).
Because it operates at the kernel level, eBPF doesn’t care if your services are written in Go, Java, Python, or Rust; there’s no need to use a different instrumentation approach for each language. It sees all the syscalls, and network traffic just the same. It’s also lightweight, with minimal performance overhead.
When you’re monitoring dozens of services and can’t ask every developer to instrument their code, eBPF is the key to turning partial visibility into true observability.
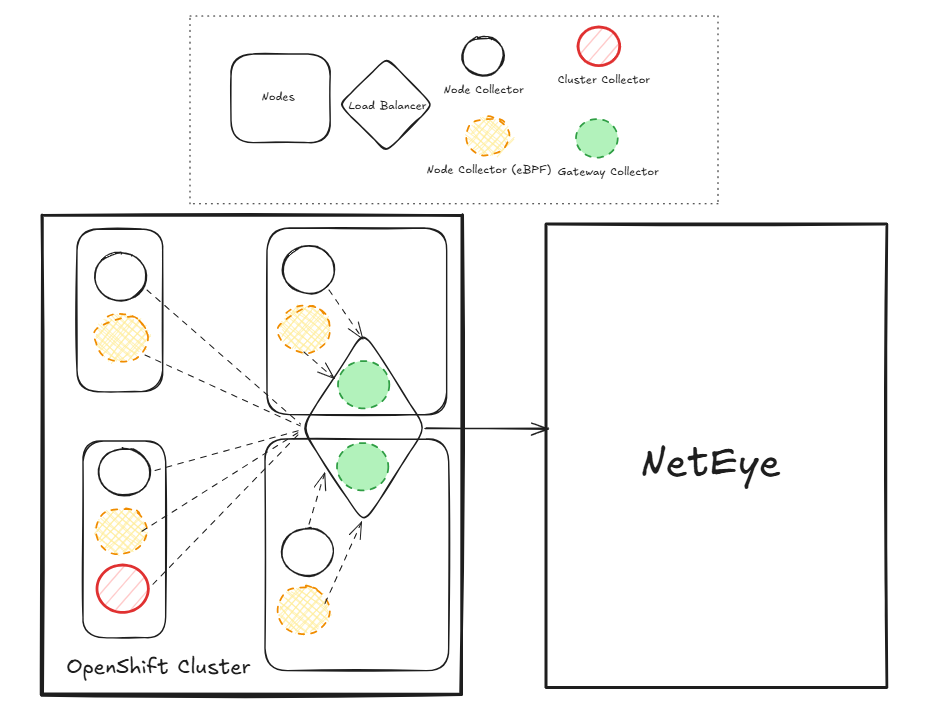
Our Hybrid Solution
Here’s the setup we landed on.
First, we used the standard OpenShift operator to install and manage the Red Hat build of OpenTelemetry. This handled the main collector pipeline for receiving, processing, and exporting telemetry to NetEye, all in a way the customer’s ops team was comfortable with.
Second, we deployed the OpenTelemetry eBPF instrumentation as a separate DaemonSet, with one pod on each node. This component captured all the rich, kernel-level traces and metrics, feeding them right into our gateway collectors.
Getting the two layers to communicate seamlessly required some fine tuning. For instance, we had to tweak our standard OpenTelemetry Collector configurations to adjust for the specifics of OpenShift. This was a straightforward fix, and honestly, making these kinds of adjustments to fit our clients’ unique needs and constraints is part of our standard process.
After a few hours of work, the solution gave us the best of both worlds: the Operator provided the managed collector infrastructure the customer wanted, and the eBPF DaemonSet delivered the deep, zero-code instrumentation we needed.
Lessons Learned the Hard Way
A few things we ran into that are worth sharing:
“Operator-managed” doesn’t mean “zero-config.” We assumed the operator would handle all the RBAC and security setup. It mostly does, but some receivers need extra ClusterRoles and RoleBindings that you have to create manually. On OpenShift, with its stricter security model, that also means dealing with Security Context Constraints (SCCs), a step that should not be underestimated.
eBPF needs privileged pods. There’s no way around it (actually there is something, but we will not look into it today), and it’s arguably the biggest drawback: loading eBPF programs into the kernel requires elevated privileges. On OpenShift, this means granting a privileged SCC to the eBPF DaemonSet’s ServiceAccount, which is a critical conversation to have with the security team.
Dashboards need love. As mentioned, the out-of-the-box Elastic Kubernetes dashboards won’t work correctly with non-EDOT collectors. Even on similar projects, you should still expect to spend some time getting them to work properly.
Data volume from eBPF can surprise you. Kernel-level events generate lots of telemetry data. Make sure your collector pipeline has proper batching and filtering configured, or you’ll overwhelm your systems.
Conclusion
This project was a practical lesson in flexible observability. It reminded us that there is no one-size-fits-all solution; a successful project often depends on the ability to adapt, swap components, and fill the gaps with custom work. The “it just works” scenarios are nice, but they’re also rare. It’s the projects that force you to get creative that really push you to be better and improve your solutions.
For teams deeply integrated with the OpenShift ecosystem, the Red Hat Build of OpenTelemetry is a perfectly viable alternative to our standard approach. The real key to unlocking deep visibility, however, was eBPF, which provided insights that application-level instrumentation alone couldn’t offer.
While this modular path requires more hands-on work, including building custom dashboards and tuning configurations, the payoff is a powerful and tailored solution. Ultimately, having a fully OTLP-compatible backend like Elastic within NetEye is what makes this flexibility possible, giving teams the freedom to choose the right collector for their specific environment.
These Solutions are Engineered by Humans
Did you find this article interesting? Are you an “under the hood” kind of person? We’re really big on automation and we’re always looking for people in a similar vein to fill roles like this one as well as other roles here at Würth IT Italy.
Francesco Penasa
Hi! I'm Francesco, Observability Engineer at Wuerth IT Italy focused on making sure complex systems stay transparent, predictable and do exactly what they're supposed to. That drive traces back to my Master's in Computer Science, where formal methods and the theoretical foundations of the field taught me to care deeply about correctness and understanding the root cause of things. That same curiosity naturally pulled me into software development, and more recently into AI and machine learning (including LLMs of course), which are, for better or worse, the opposite of deterministic. It's a strange place to end up for someone who likes things to behave. My biggest daily challenge? Myself. I firmly believe that comfort zones are overrated, so I constantly push myself to take on new challenges and keep laziness at bay. Spoiler: it's an ongoing battle.
Author
Latest posts by Francesco Penasa
16. 03. 2026
APM, Development
Bringing OpenTelemetry to Flutter Android for Client-side Observability