Configuring Microsoft Servers: Authentication and Permissions Settings
In this blog I will provide you a how-to for configuring agentless monitoring for Microsoft Servers or Workstations via WMI.
What is WMI? Windows Management Instrumentation (WMI) is Microsoft’s implementation of an industry-standard approach to accessing management information in an enterprise environment. WMI uses the industry-standard Common Information Model (CIM) to represent systems, applications, networks, devices, and other managed components. CIM is developed and maintained by the Distributed Management Task Force (DMTF). [More on msdn.microsoft.com].
Here’s what we will go over in this tutorial in order to ensure that you have the right requirements to set up your WMI-based Windows server or workstation monitoring:
- Check that the Microsoft WMI service is running
- Configure Microsoft WMI user account and rights
- Configure the necessary NetEye software packages
- Configure monitoring with check_wmi_plus
Note: This guide is compatible with Windows Server 2008 R2 or newer.
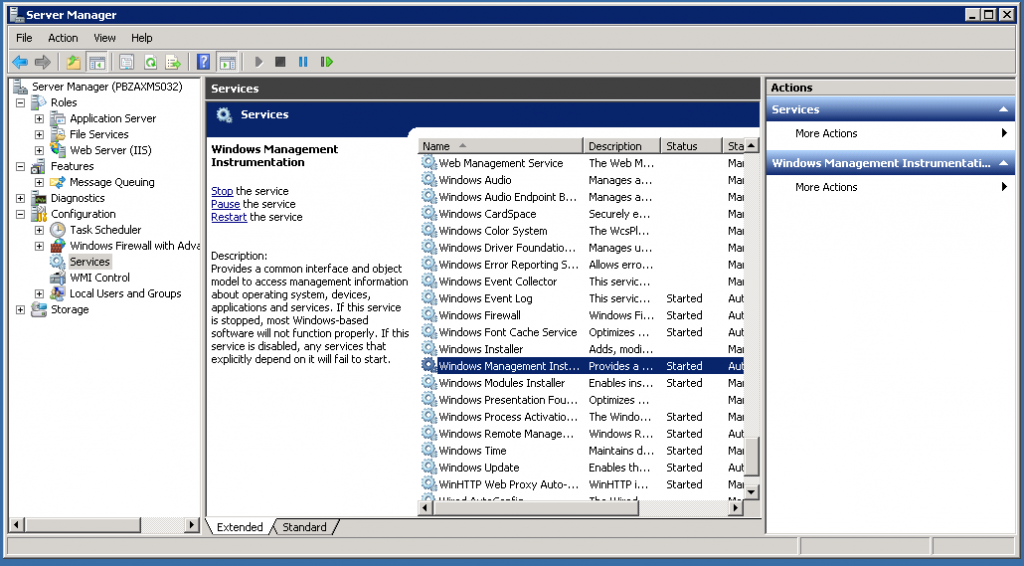
WMI Service: verify service status
Verify that the WMI service is running by using the server manager, or by running “services.msc”.
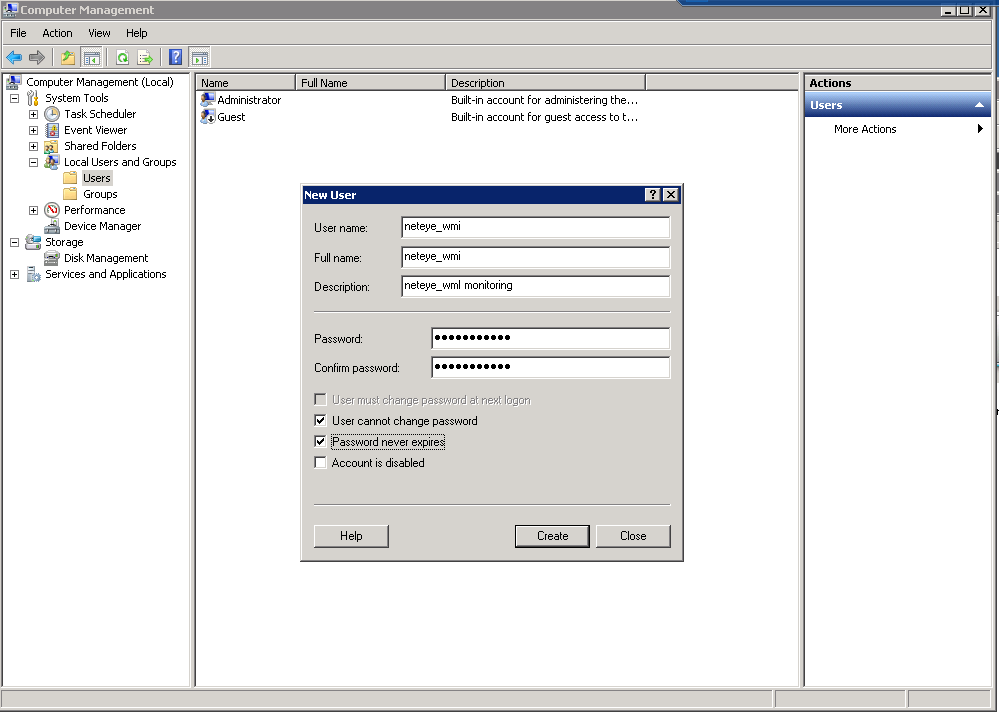
WMI user account and rights configuration
Create a local or domain user to access the Windows Server remotely:
- Local user account: Go to Computer Management and create a local account (non-administrative user)
- Domain user: Assign the domain user in Control Panel → User Accounts
Local user definition example:
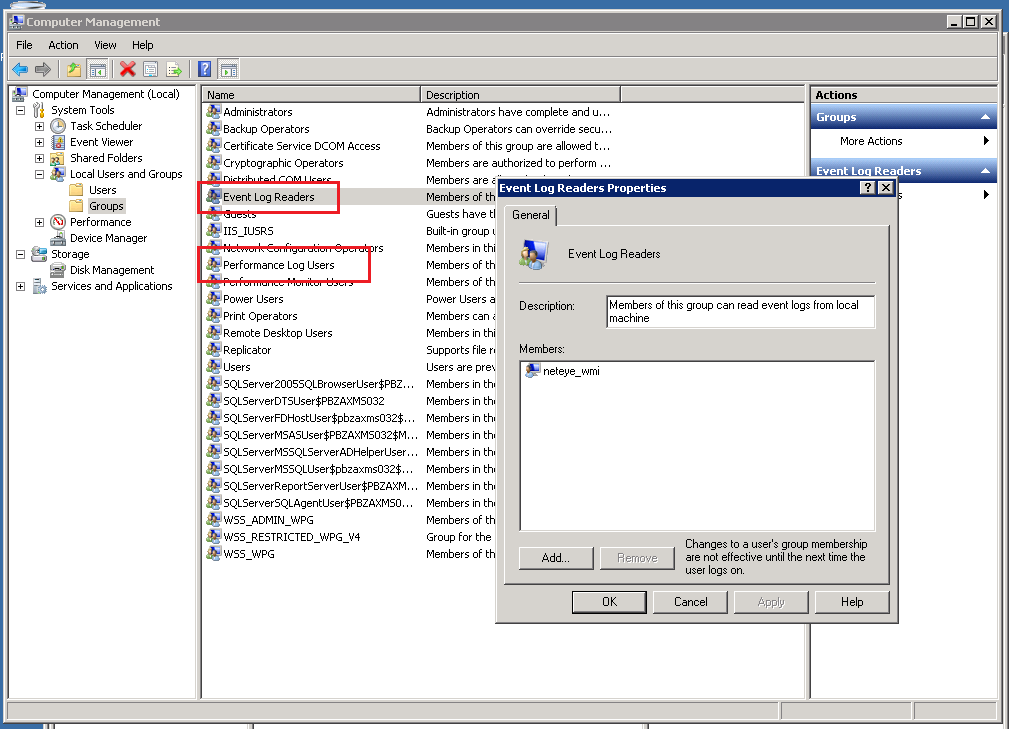
Grant users permission to access system data
To perform monitoring, the user account needs permission to access:
- System Performance Data (performance data collection, i.e. CPU, Memory, etc.)
- System EventLog (for eventlog monitoring)
To grant those permissions, assign the user to both of these system groups:
- Performance Log Users
- Event Log Readers
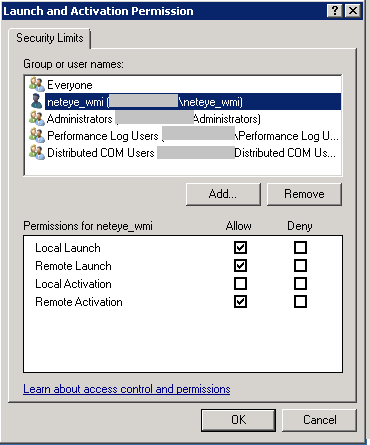
Adding remote activation privileges to Windows DCOM
Next, we need to give our newly created user access to DCOM on localhost. In order to do this, open Component Services:
- Click Start and choose Run. Enter “DCOMCnfg.exe” and then click OK.
- Expand Component Services, and drill down to the local computer.
- Right click on My Computer and select Properties.
- Select the “COM Security” tab, and then choose the Edit Limits… button from the Launch Activation Permissions section.
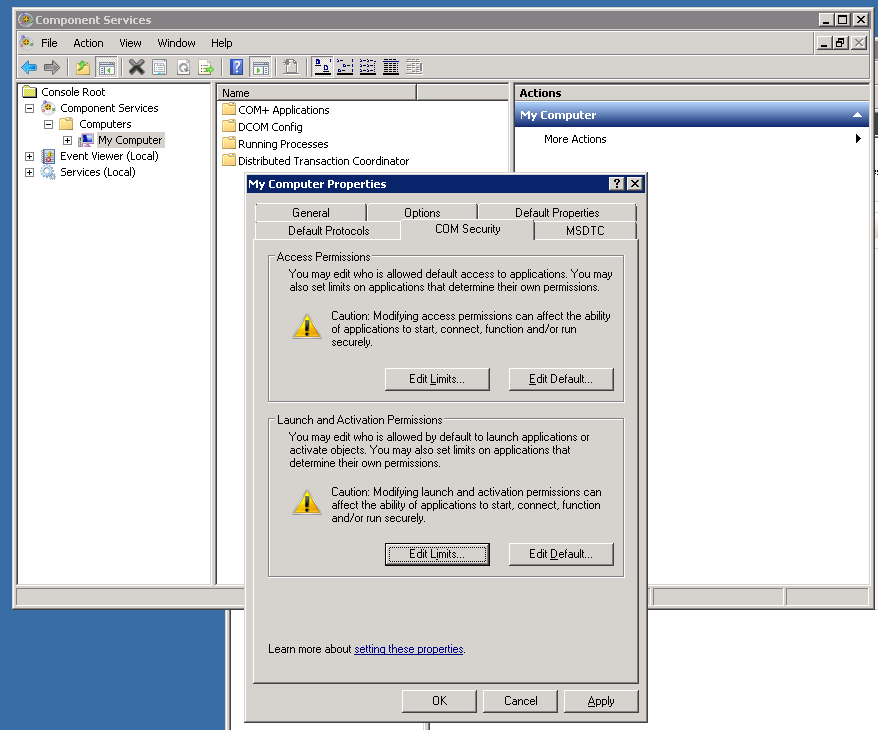
- Add the user who will be used by NetEye to monitor this machine: we’ll use “neteye_wmi” in this example.
- Assign the following permissions to this user: tick the Remote Launch and Remote Activation boxes under the column “Allow”.
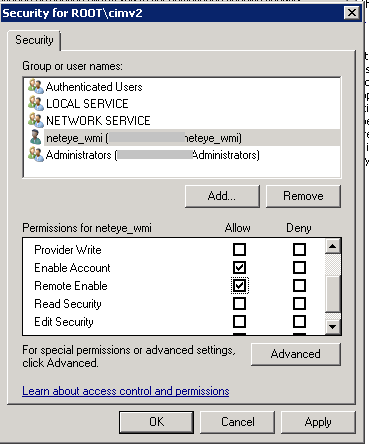
Adding remote WMI access
In order to remotely access the monitored machine via this user account and obtain the required data from the CIM structure via WMI, you must enable access to the WMI namespace CIMV2.
- Click Start, choose Run, type “WMImgmt.msc“, right click on WMI Control (local), and select Properties.
- Select the Security tab of the WMI Control Properties.
- Expand the Root node, right click on CIMV2, and then select Properties.
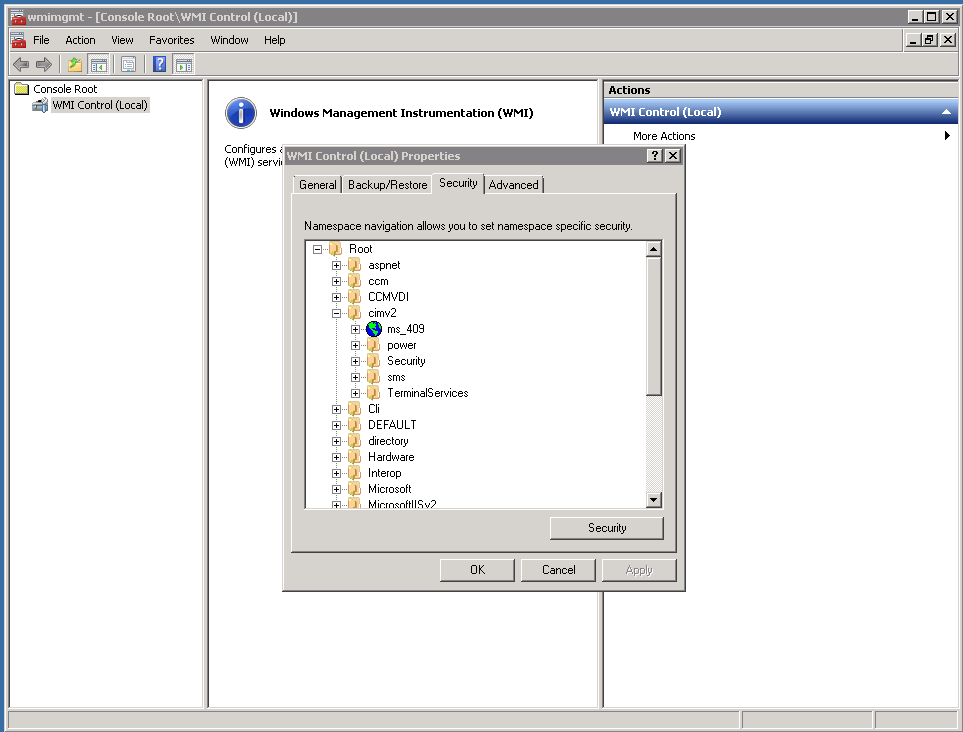
- Add our user “neteye_wmi” to the allowed list.
- Tick the Enable Account and Remote Enable boxes in the Allow column, and then confirm.
Windows Firewall Settings
Finally, verify in your firewall settings that the firewall rules are configured to allow incoming WMI requests.
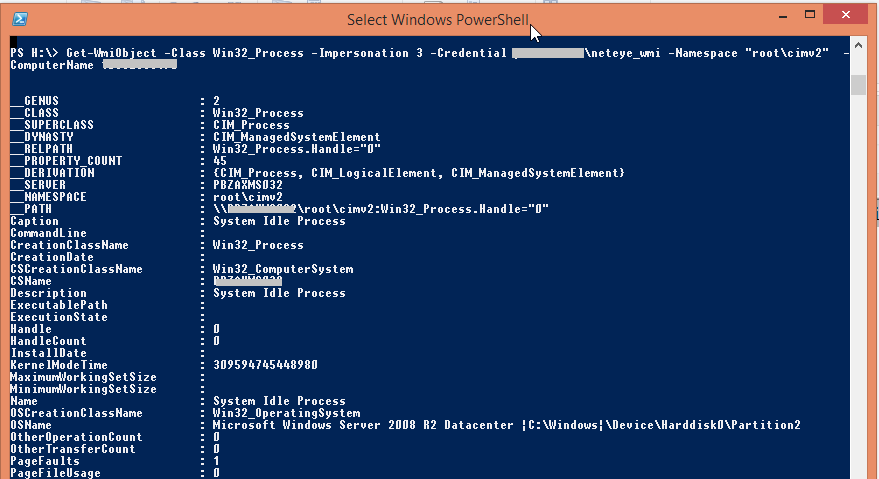
Get ready for your first test query
Now you can test WMI via a remote call:
- Start PowerShell on a remote computer
- Run the following command to test a WMI call with the configured users against the monitored Microsoft Server:
Local connection test:
Get-WmiObject -Namespace "root\cimv2" -Class Win32_Process -Impersonation 3 |
Connecting from the remote computer with credentials:
Get-WmiObject -Class Win32_Process -Impersonation 3 -Credential domain\neteye_wmi -Namespace "root\cimv2" -ComputerName computer.domain |
For more information on this topic as well as for troubleshooting tips, take a look at this article.
NetEye Configuration
Install WMIC
[root@neteye ]# yum --enablerepo=neteye install wmic |
Perform a test WMI call using wmic.
Example data used:
- Domain: net.local
- User name: neteye
- Password: secret
- Host name: windows01
[root@neteye ~]# wmic -U net.local/neteye%secret --option="client ntlmv2 auth"=Yes //windows01 "SELECT FreeSpace,Size,Name from Win32_LogicalDisk where DriveType=3"CLASS: Win32_LogicalDiskDeviceID|FreeSpace|Name|SizeC:|27660132352|C:|101897465856D:|55664553984|D:|268432306176E:|20483117056|E:|268432306176 |
Monitoring WMI using check_wmi_plus
The open source plugin check_wmi_plus is an enhancement to the check_wmi.pl script and provides an extensive list of monitoring modes implemented as WMI queries inside this check. At this moment I would like to say a big thank you to the community for its work, and invite you to visit this portal for further details: http://www.edcint.co.nz/checkwmiplus/.
Now it’s time to get ready on NetEye by installing required packages for this check:
[root@neteye ~]# yum --enablerepo=neteye install perl-Number-Format perl-Config-IniFiles |
Now download the check_wmi_plus archive and prepare the configuration. The latest version and the plugin’s related documentation can be found on the project portal:
http://www.edcint.co.nz/checkwmiplus/
- Untar the archive into a local folder, e.g.: /tmp/check_wmi_plus/
On NetEye 3.x we want to install the plugin in /usr/lib64/nagios/plugins, and thus we:
- Create a folder holding all configuration and .ini files
- Copy the content of etc/* into the plugins directory
- Configure the file check_wmi_plus.conf and set the variable $base_dir
Update 15.1.2019: It is suggested to set in check_wmi_plus.conf this parameter to “1”: $ignore_my_outdated_perl_module_versions=1;
[root@neteye ~]# mkdir -p /usr/lib64/nagios/plugins/check_wmi_plus/etc[root@neteye ~]# cp -r /tmp/check_wmi_plus/etc/* /usr/lib64/nagios/plugins/check_wmi_plus/etc/[root@neteye ~]# cat /usr/lib64/nagios/plugins/check_wmi_plus/etc/check_wmi_plus/check_wmi_plus.conf(Row 16)$base_dir='/usr/lib64/nagios/plugins'; |
Place check_wmi_plus.pl in the plugins path and adapt the configuration path inside the check_wmi_plus.pl file:
[root@neteye ~]# cp -r /tmp/check_wmi_plus/check_wmi_plus.pl /usr/lib64/nagios/plugins/[root@neteye ~]# vi check_wmi_plus.pl(Row 30)my $conf_file='/usr/lib64/nagios/plugins/check_wmi_plus/etc/check_wmi_plus/check_wmi_plus.conf'; |
Now run a preliminary check from the command line to make sure everything is working:
[root@neteye ~]# /usr/lib/nagios/plugins/check_wmi_plus.pl -H myhost -u username -p secret --extrawmicarg --option="client ntlmv2 auth"=Yes -m checkmem -w 98 -c 100 OK - Physical Memory: Total: 12GB - Used: 11.743GB (98%) - Free: 263.027MB (2%)|'Physical Memory Used'=12608565248Bytes; 'Physical Memory Utilisation'=98%;98;100; |
Monitoring using the provided Profile:
Upload and import the Service Profile into Monarch:
- Go to the “NetEye Configuration” menu.
- Access Profiles and make use of the “Profile importer” to upload the provided .xml file.
- Next, select the Service profile “service-profile-sp-wmi-services.xml” you will find in the list, and then “Import”.
- Now the Service profile will be available with a list of ready-to-use Service checks. One of those checks is the disk space check shown in the example above.
Here you will find the Monarch service profile for download:
Update 15.1.2019: Visit my Repo on Github. Here you find:
- a copy of the Plugin
- a sample configuration of check_wmi_plus.conf
- short instructions for configuring the check
Ready to start monitoring!
Create a host, assign the service checks, configure thresholds and … check the results:

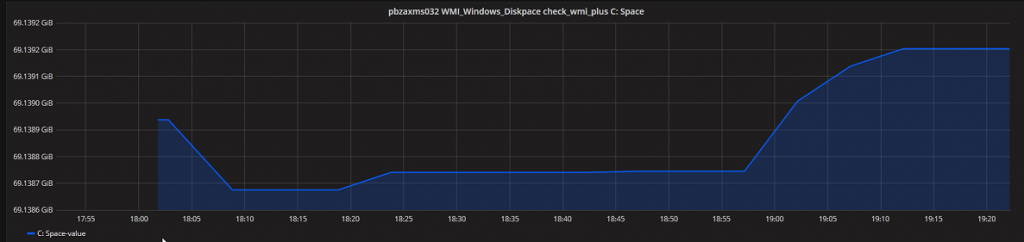
Performance graph of disk-usage in Grafana:
Enjoy monitoring with WMI ,)