30. 06. 2026
Azure, Cloud, Microsoft, NetEye, NetEye Extension Packs, Unified Monitoring

With this blog I want to show you how to use Grafana 5 and Telegraf to give NetEye 3’s Tactical Monitoring Overview a great new look.
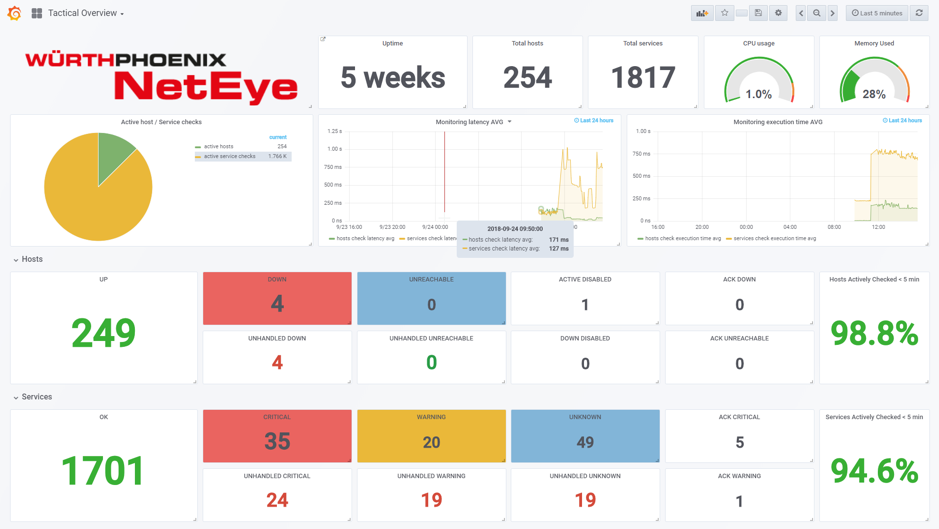
The current Tactical Monitoring Overview is based on the Thruk frontend, and provides a lot of information about the current monitoring status. This includes the status of hosts, services, typical daily IT Operations (acknowledge and downtime), and monitoring performance (host and service check execution time, host and service check latency, and so on).
To make this information available to Grafana, and to be able to create our dashboard, you need to:
- Obtain Thruk metrics related to the Tactical Monitoring Overview
- Store the metrics in InfluxDB (a time series database included in NetEye)
To achieve the first goal you can retrieve the statistics in JSON format available from Thruk through this URL: http://USER:PASSWORD@NETEYE-HOSTNAME/thruk/cgi-bin/tac.cgi?view_mode=json
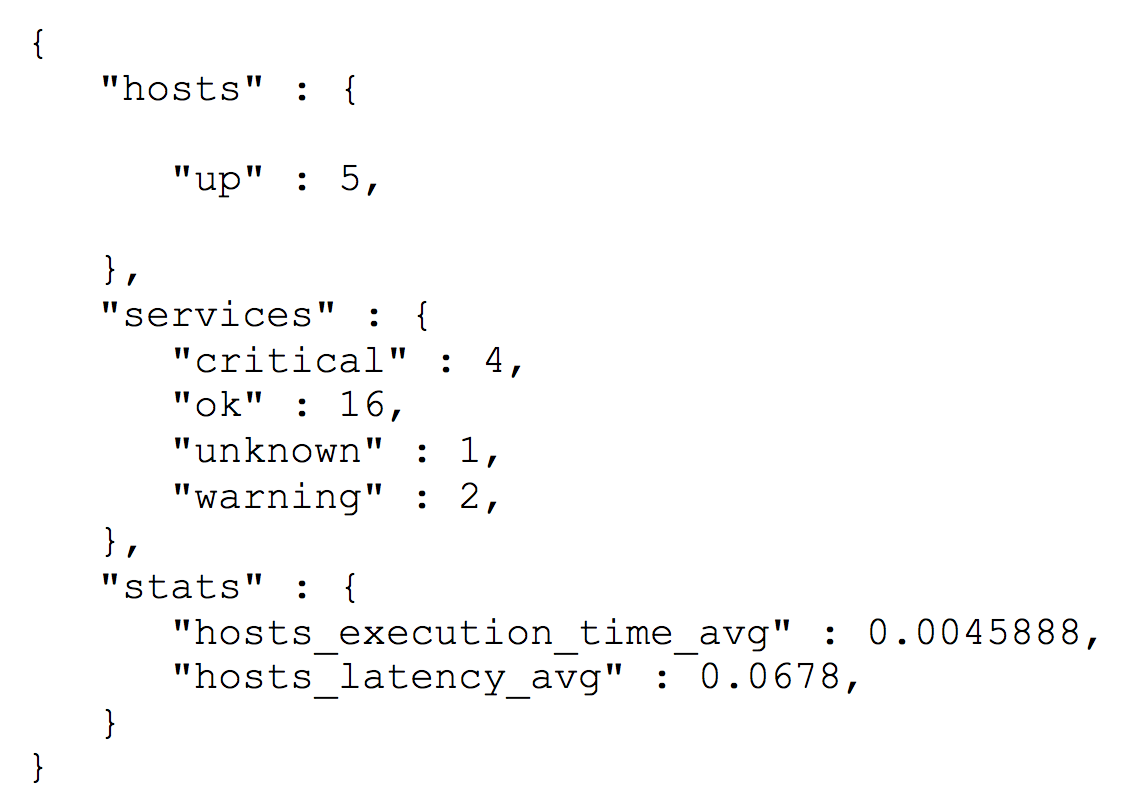
This very useful page provides all available information in the Tactical Monitoring Overview, divided into three groups: hosts, services and stats. Here is an example:
It is important to test access by calling the curl command on the NetEye host with the URL above as a parameter.
To achieve the second goal, you can use the Telegraf package recently released in NetEye 3.14.
Telegraf is an agent for collecting, processing, aggregating, and writing metrics, and provides a useful input plugin that allows you to store data available in JSON format in InfluxDB.
To enable this plugin, you need to add a section to the file /etc/nagios/neteye/telegraf/telegraf.conf as in this example:
[[inputs.httpjson]]
name = “tactical_overview”servers = [
“http://user:password@NETEYE-HOST/thruk/cgi-bin/tac.cgi?view_mode=json”,
]
response_timeout = “5s”method = “GET”
tag_keys = [
“hosts”,
“services”,
“stats”,
]
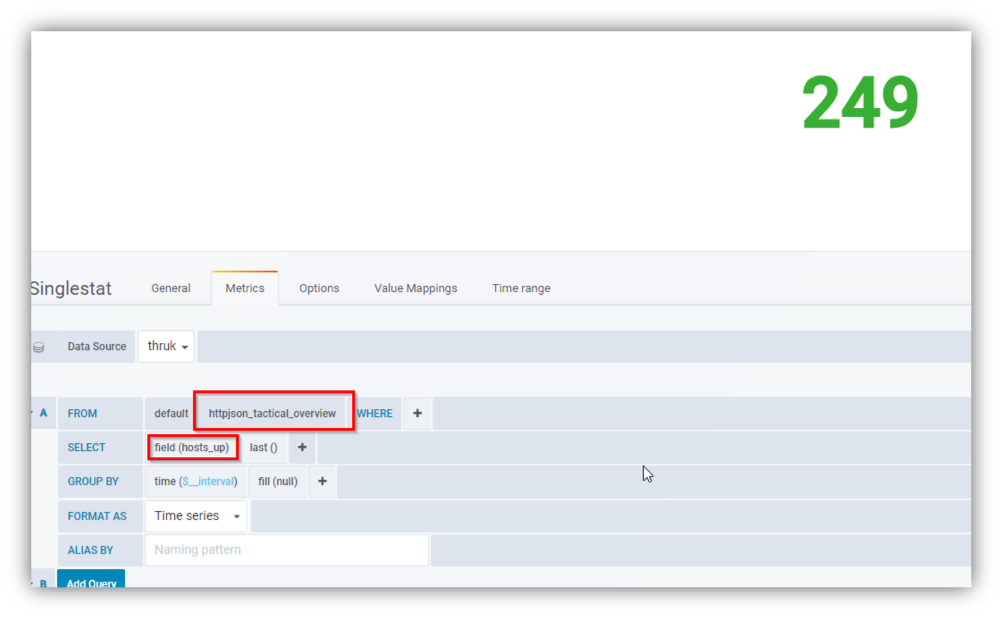
After restarting Telegraf with the command “# service telegraf restart“, we will have a new set of measurements called httpjson_tactical_overview.
Thanks to these new measurements we can get, for example, the number of hosts in status UP by selecting the host_up field:
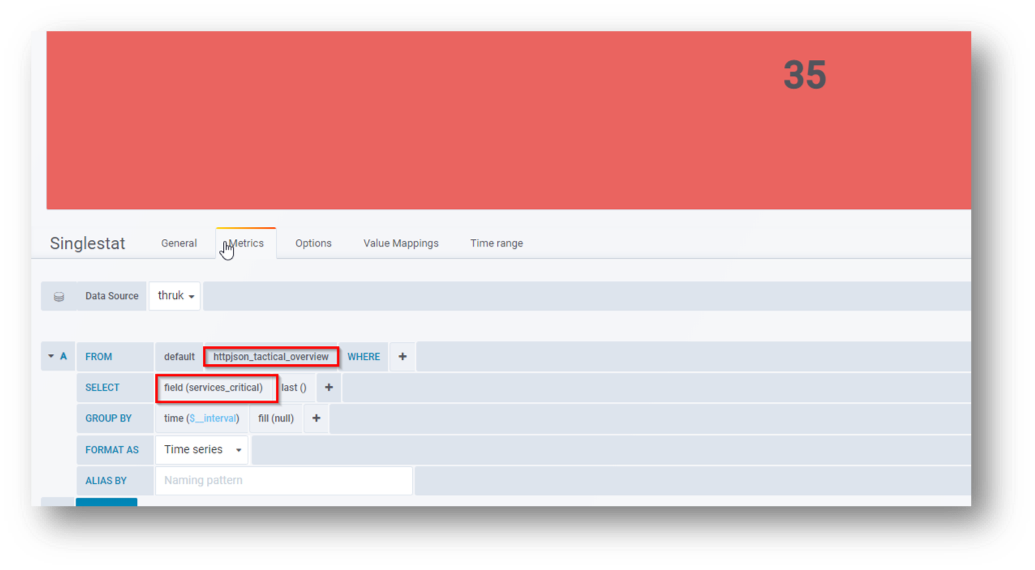
Or, the number of services in a critical state by selecting the services_critical field:
Thanks to this simple configuration, you can give a fresh update to your Tactical Monitoring Overview, while also integrating other information on the operating status of your NetEye system, highlighting those indicators you think are most useful or interesting.

Giuseppe Di Garbo
Consultant at Würth IT Italy
Hi everybody. I’m Giuseppe and I was born in Milan in 1979. Since the early years of university, I was attracted by the Open Source world and operating system GNU\Linux. After graduation I had the opportunity to participate in a project of a startup for the realization of an Internet Service Provider. Before joining Würth Phoenix (now Würth IT Italy) as SI consultant, I gained great experience as an IT consultant on projects related to business continuity and implementation of open source software compliant to ITIL processes of incident, change and service catalog management. My free time is completely dedicated to my wife and, as soon as possible, run away from Milan and his caotic time and trekking discover our beautiful mountain near Lecco for relax and lookup the (clean) sky.
Author
Latest posts by Giuseppe Di Garbo
23. 06. 2026
Atlassian
Customer Feedback in Jira Service Management: CSAT and Native Surveys Explained
19. 12. 2025
Atlassian, Service Management
Jira Service Management Customer Detail Fields: A Practical Use Case
29. 09. 2025
Atlassian, Service Management
Streamlining Service Request Management with ITIL4 and Jira Service Management
30. 06. 2025
Atlassian, Service Management
Creating Jira Service Management Requests from a Public Website? Here’s the Secure, No-API Way