
Telegraf Plugin for VMware Counters from a Windows Guest OS
Telegraf is a plugin-driven agent for collecting metrics from various sources (based on the configured input plugins), preprocessing and aggregating them (based on configured processor and aggregator plugins), and forwarding them to the desired destinations (depending on the configured output plugins).
Telegraf is used throughout NetEye to collect performance data, forward them to InfluxDB where they are stored as time series data, and make them available for further analysis and visualization though Grafana.
So, why not also use Telegraf to collect data and performance metrics for VMware virtual machines running Windows?
Indeed, VMware provides read-only APIs for monitoring VM statistics through the vSphere Guest SDK. The runtime components providing those APIs are installed when you install VMWare Tools. The missing “piece in the puzzle” is a Telegraf plugin that can “wrap” those APIs and make metrics available for Telegraf.
In versions 3.14 and 4.2 of NetEye, this plugin is already available! And configuring it is pretty simple, too. Edit the Telegraf configuration file and enable the [[inputs.vmwareguest]] plugin, then choose the metrics you are interested in (both type:numerical and string) and set the sampling interval. If you have configured InfluxDB as output destination, then once the Telegraf agent has started you can collect metrics as time series data and visualize it in Grafana.
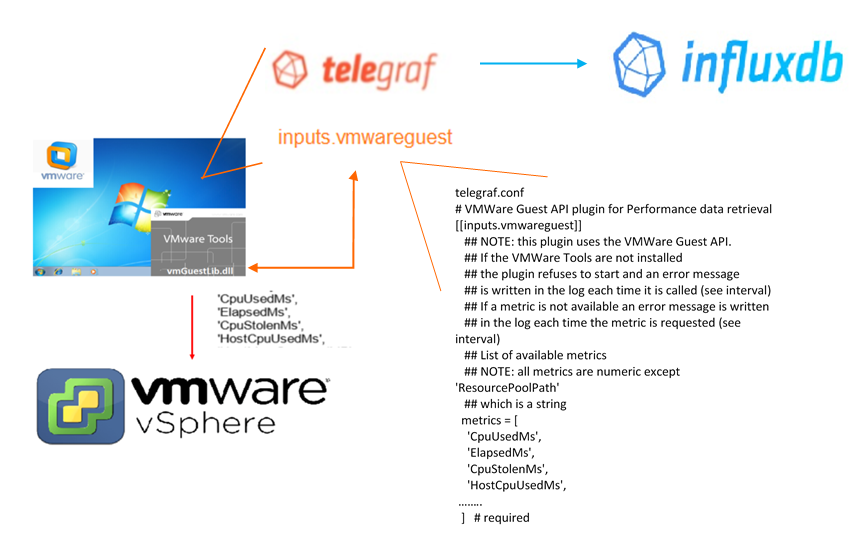
The flow of collected metrics
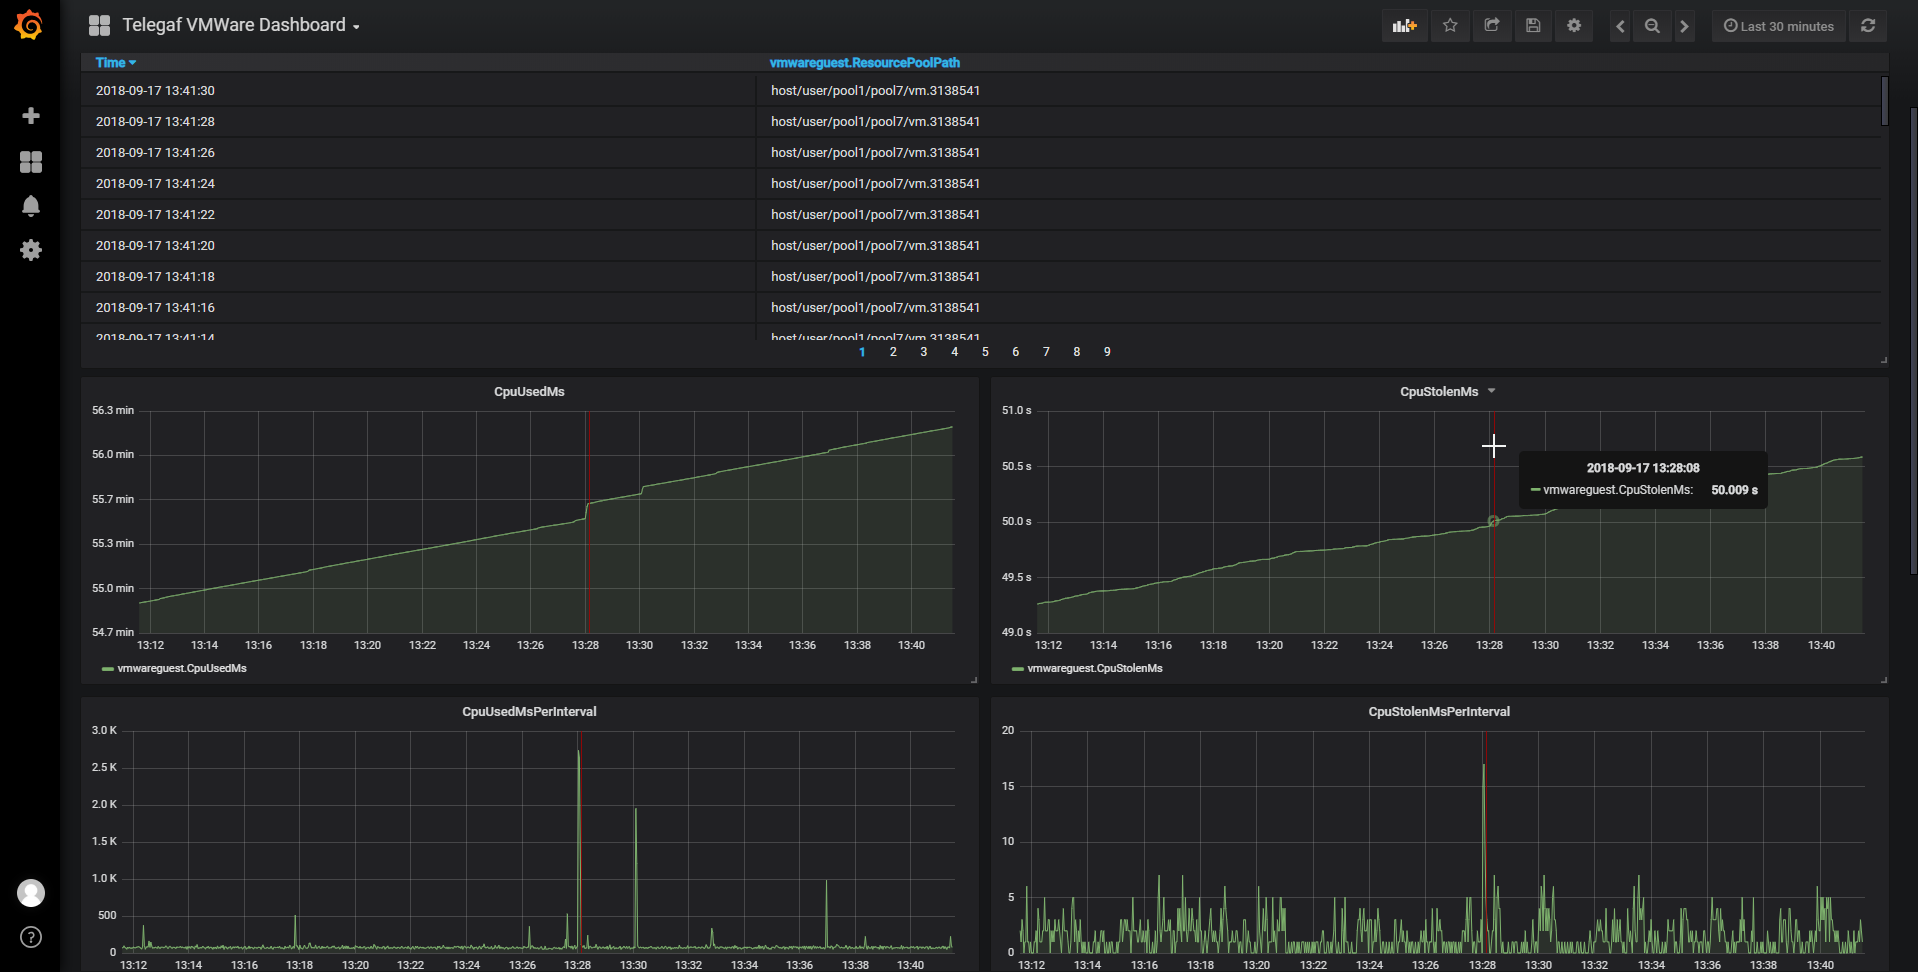
View collected time series data in Grafana
To see the full list of metrics that can be collected (if available on the VM) run:
C:\Program Files\Telegraf\telegraf.exe config
# VMWare Guest API plugin for Performance data retrieval
[[inputs.vmwareguest]]
## NOTE: this plugin uses the VMWare Guest API.
## If the VMWare Tools are not installed
## the plugin refuses to start and an error message
## is written in the log each time it is called (see interval)
## If a metric is not available an error message is written
## in the log each time the metric is requested (see interval)
## List of available metrics
## NOTE: all metrics are numeric except ‘ResourcePoolPath’
## which is a string
metrics = [
‘CpuUsedMs’,
‘ElapsedMs’,
‘CpuStolenMs’,
‘HostCpuUsedMs’,
‘HostMemSwappedMB’,
‘HostMemSharedMB’,
‘HostMemUsedMB’,
‘HostMemPhysMB’,
‘HostMemPhysFreeMB’,
‘HostMemKernOvhdMB’,
‘HostMemMappedMB’,
‘HostMemUnmappedMB’,
‘ResourcePoolPath’,
‘CpuReservationMHz’,
‘CpuLimitMHz’,
‘CpuShares’,
‘HostProcessorSpeed’,
‘MemReservationMB’,
‘MemLimitMB’,
‘MemShares’,
‘MemMappedMB’,
‘MemActiveMB’,
‘MemOverheadMB’,
‘MemBalloonedMB’,
‘MemSwappedMB’,
‘MemSharedMB’,
‘MemSharedSavedMB’,
‘MemUsedMB’,
‘MemTargetSizeMB’,
‘HostNumCpuCores’,
‘CpuUsedMsPerInterval’,
‘CpuStolenMsPerInterval’,
‘ElapsedMsPerInterval’
] # required

its a very nice topic for me