
24. 07. 2019
Franco Federico
Anomaly Detection, Log-SIEM, NetEye
Welcoming Elastic Stack X-Pack to NetEye 4
On June 13, we announced a new OEM Partnership with Elastic, and Elastic updated its relationship with OEM, MSP and CSP partners, with the result that in NetEye 4 we now have some new features.
Starting with NetEye 4.6, you can now activate the X-Pack feature.
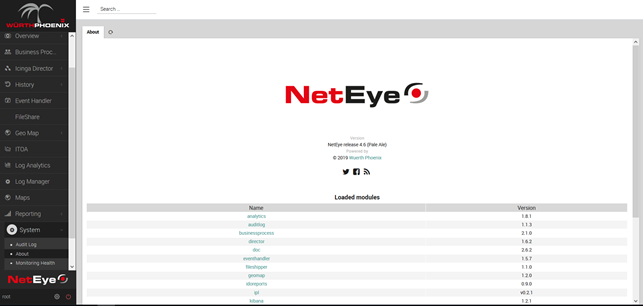
After I activate X-Pack and open NetEye, I see:
Next I click on Log Analytics and voilà!
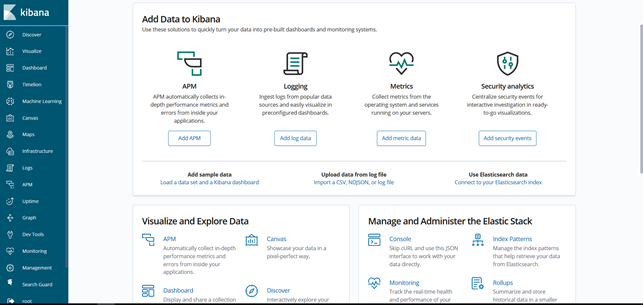
I now have many new features that I can use.
Discover, Visualize, Dashboard, and Dev Tools are applications that everyone who uses Elastic Stack is familiar with.
Timelion is a time series data visualizer that enables you to combine completely independent data sources within a single visualization. It’s driven by a simple expression language you can use to retrieve time series data, perform calculations to tease out the answers to complex questions, and visualize the results. In 7.x, the Timelion application will no longer be visible in the main menu, but will still be available from Kibana’s side menu. Timelion visualizations will also still exist in Visualize.
Then, there is the Elastic machine learning features that automatically model the normal behavior of your time series data (learning trends, periodicity, and more) in real time to identify anomalies, streamline root cause analysis, and reduce false positives. The machine learning features run in and scale with Elasticsearch. With this application, it’s possible to create anomaly detection jobs and understand the results.
Canvas is a whole new way of making data look amazing. Canvas combines data with colors, shapes, text, and your own imagination to bring dynamic, multi-page, pixel-perfect, data displays to screens large and small.
The Maps application enables parsing through geographical data at scale and in real time. With features like multiple layers and indices in a map, plotting of raw documents, dynamic client-side styling, and global search across multiple layers, it’s possible to understand and monitor your data with ease.
The Infrastructure application allows you to monitor your infrastructure and identify problems in real time. You can also explore metrics and logs for common servers, containers, and services.
Logs lets you explore logs for common servers, containers, and services. Kibana provides a compact, console-like display.
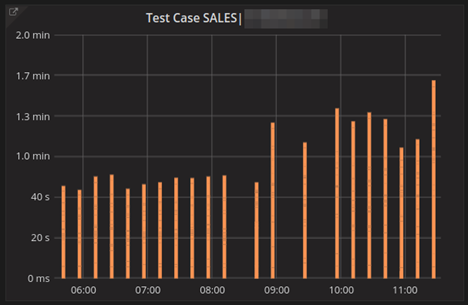
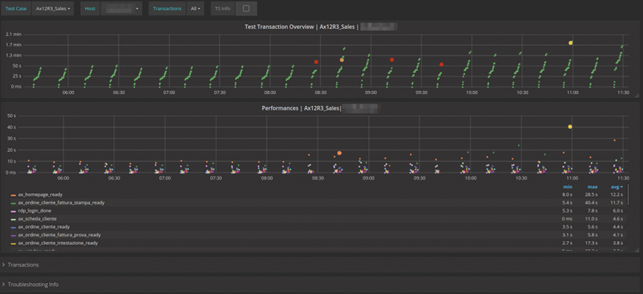
Elastic’s Application Performance Monitoring (APM) automatically collects in-depth performance metrics and errors from inside your applications. The APM page enables developers to drill down into the performance data for their applications and quickly locate performance bottlenecks. Personally for me, this is first step I do after implementing the monitoring of the real user experience by building test cases by Alyvix. These test cases help IT Managers follow the user experience in real time and collect user-centered data in order to have an historical overview. For this reason, I use a three-level dashboard:
First level: A single bar that indicates the overall duration of the complete test.
Second level: Average statistics for each transaction in the test cases. To the human eye, it is much easier in this case to interpret curves instead of bars. So the question is no longer whether something is running or not, but how well and/or stable it is running compared to historic values.
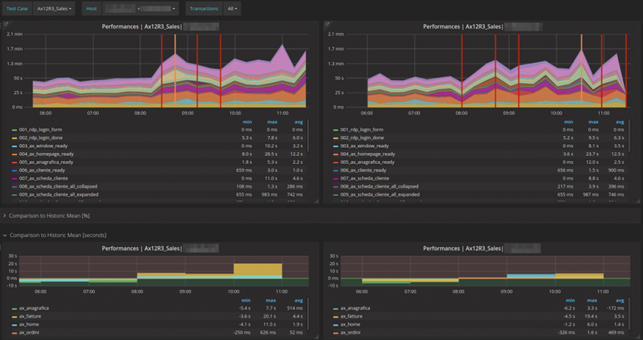
Third level: Detailed, historical data can be used during troubleshooting if necessary to analyze the behavior of application.
Continuing with the exploration of new features, the Uptime application permits monitoring the status of network endpoints via HTTP/S, TCP, and ICMP. It will be possible to explore status over time, drill into specific monitors, and view a high-level snapshot of your environment at a selected point in time.
Graph’s analytics features enable you to discover how items in an Elasticsearch index are related. You can explore the connections between indexed terms and see which connections are the most meaningful. This can be useful in a variety of applications, from fraud detection to recommendation engines. For example, graph exploration could help you uncover website vulnerabilities that hackers are targeting so that you can harden your website. Or, you can provide graph-based personalized recommendations to your e-commerce customers.
The Monitoring features serve two separate purposes:
- To visualize monitoring data from across the Elastic Stack. You can view health and performance data for Elasticsearch, Logstash, and Beats in real time, as well as analyze past performance.
- To monitor Kibana itself and route that data to the monitoring cluster.
The Management application contains additional new features shown here:
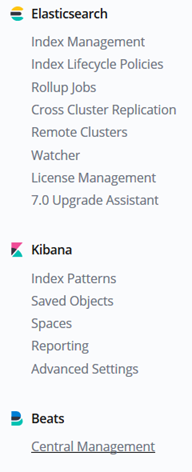
Index Lifecycle Policies allows you to configure policies, such as updating an existing index lifecycle policy to fix errors or change strategies for newly created indices.
Rollup Jobs lets you configure a periodic task that summarizes data from indices specified by an index pattern and rolls it into a new index.
Watcher enables the monitoring, managing, creation and simulation of watches for your Elasticsearch indices.
Space allows you to organize dashboards and other saved objects into meaningful categories. Inside a space, you can see the dashboards and other saved objects that belong to that space. You can change the active space at any time.
And finally, Reporting lets you generate reports that contain Kibana dashboards, visualizations, and saved searches. Dashboards and visualizations can be exported as PDF documents, while saved searches from Discover can be exported to CSV.
In my next blog, I will explore Watcher, and show you how to use it to send a real time notification to NetEye by using Tornado, another new application in the NetEye ecosystem.
Franco Federico
Hi, I’m Franco and I was born in Monza. For 20 years I worked for IBM in various roles. I started as a customer service representative (help desk operator), then I was promoted to Windows expert. In 2004 I changed again and was promoted to consultant, business analyst, then Java developer, and finally technical support and system integrator for Enterprise Content Management (FileNet). Several years ago I became fascinated by the Open Source world, the GNU\Linux operating system, and security in general. So for 4 years during my free time I studied security systems and computer networks in order to extend my knowledge. I came across several open source technologies including the Elastic stack (formerly ELK), and started to explore them and other similar ones like Grafana, Greylog, Snort, Grok, etc. I like to script in Python, too. Then I started to work in Würth Phoenix like consultant. Two years ago I moved with my family in Berlin to work for a startup in fintech(Nuri), but the startup went bankrupt due to insolvency. No problem, Berlin offered many other opportunities and I started working for Helios IT Service as an infrastructure monitoring expert with Icinga and Elastic, but after another year I preferred to return to Italy for various reasons that we can go into in person 🙂 In my free time I continue to dedicate myself to my family(especially my daughter) and I like walking, reading, dancing and making pizza for friends and relatives.
Author
Latest posts by Franco Federico
10. 06. 2026
Unified Monitoring
Transform Metrics into Alerts
10. 03. 2026
Unified Monitoring
Elastic AutoOps in NetEye: Simplifying Elasticsearch Operations with Real-Time Intelligence
09. 09. 2025
NetEye
Backing up a MariaDB Galera Cluster
12. 06. 2025
NetEye, Unified Monitoring
From Monitoring to SOC