21. 05. 2026
APM, Kubernetes

During the NetEye User Group in November 2019, I presented the future vision of a new, completely distributed architecture to allow more flexibility, performance and scalability. In particular, a more flexible and scalable architecture is helpful for large environments such as Managed Service Provider infrastructures or for monitoring solutions as a service (i.e., NetEye 4 SaaS).
In this blog post, I present our R&D team’s current ongoing research activities in evaluating the challenge to migrate our service-based, unified monitoring solution (NetEye 4) to a modern fully distributed and scalable solution.
As you may know, NetEye 4 provides high-availability and load distribution thanks to the Red Hat cluster technology which distributes each tier of NetEye 4 across multiple physical servers. We intend to embrace the latest architectural trends to re-design the NetEye architecture to leverage orchestration-based platforms for containerized applications. The de facto standard of microservice management is Kubernetes, which provides deployment orchestration, service scaling, and high availability for applications.
After setting up a 3-node Kubernetes cluster in an on-premise high-availability configuration, we started creating a single container application to support the basic functionalities of NetEye.
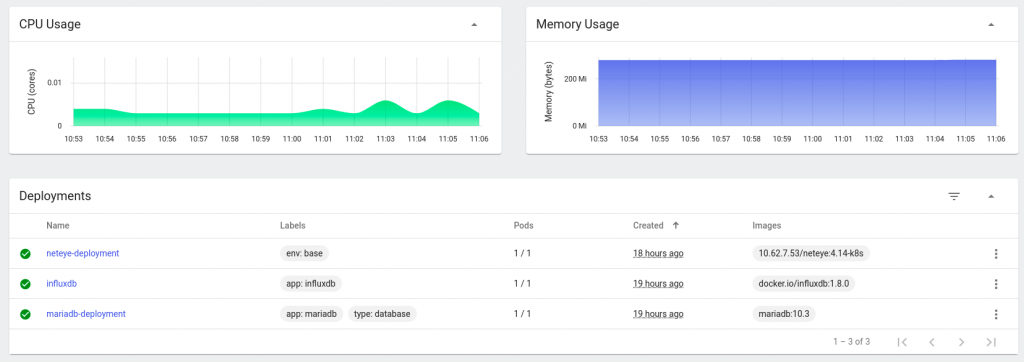
As shown in the figure above, we created 3 containers:
- NetEye running icingaweb2 and grafana UI, along with the icinga2 monitoring backend (in a future iteration we must split each component into a dedicated container)
- MariaDB as the MySQL database
- InfluxDB as the time series database
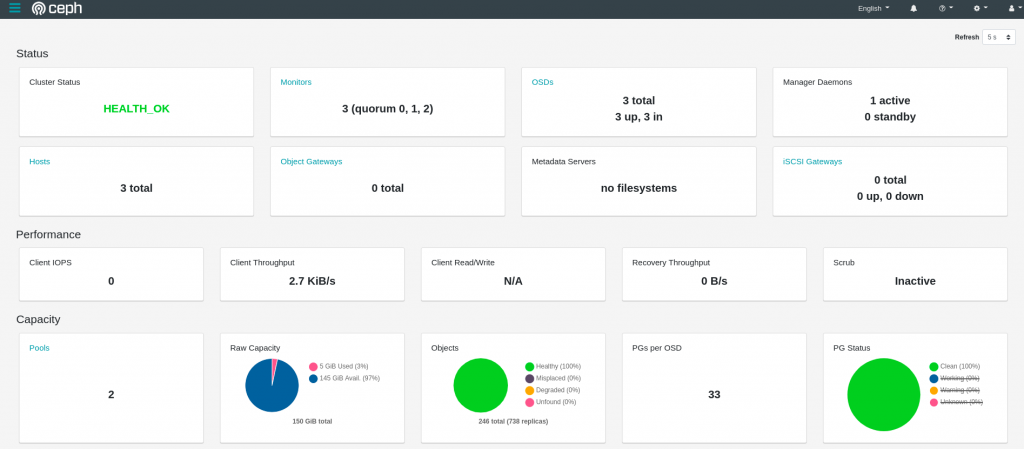
… but without persistent storage, we cannot distribute the load between the cluster nodes because as soon as a container is reallocated, all the data will be lost. For these reasons, we configured Rook with Ceph to create dynamic volumes to store data which needs to be persistent in the cluster:
We still have a lot of work to do, but this should be very helpful not only for learning, but also for trying out new architectural patterns for the NetEye of the future.
If you are interested in these on-going activities, join us at the SFSCon conference in Bolzano: Andrea Avancini and I will talk about this and much more!
Michele Santuari
Software Architect at Wuerth Phoenix
Hi, my name is Michele Santuari and I am a Telecommunication engineer felt in love with OpenFlow, the first attempt of centralized network management, provisioning, and monitoring. I embraced the Software Defined Networking approach to discover a passion for programming languages. Now, I am into Agile methodologies and crazy development process management.
Author
Latest posts by Michele Santuari
28. 12. 2020
Development
Research & Development – Spike (Part 4)
23. 12. 2020
Development
RPM/ISO Repository: Disk Space Optimization
31. 03. 2020
NetEye
How Do We Test NetEye?