22. 05. 2026
AI, NetEye, Unified Monitoring

12. 12. 2024
Reinhold Trocker
Log Management, Log-SIEM
Sample osquery Investigations for a Security Incident
Note: This description of a security analyst’s daily routine is fictitious. However, the osquery examples have been tested and can therefore be used as a template for your own research.
1. Alarm Detection
Today started with a high-severity alarm from our Elastic Security system. The alert indicated suspicious activity on host HOST-1234, suggesting potential malware execution. The severity of the alarm was classified as “High,” demanding immediate attention.
2. Immediate Response: Isolation
Upon receiving the alert, I quickly utilized the Elastic Defend feature to isolate the affected host. This step is crucial to prevent the potential spread of the threat across the network. The isolation process involves:
- Blocking all inbound and outbound network traffic for
HOST-1234.
This is a technical task, please see Isolate a host | Elastic Security Solution [8.16] | Elastic - Notifying the user about the isolation and providing instructions for further communication.
This is an organizational task that was completed by contacting the department manager by phone.
3. Ticket Creation
For the Elastic Security solutions regarding incident management (cases), see this link:
https://www.elastic.co/guide/en/security/current/cases-overview.html
Accordingly, I opened a ticket in our incident management system to document the case. The ticket includes:
- Incident ID: INC-20241203-001
- Host: HOST-1234
- Severity: High
- Description: Detected suspicious activity indicating potential malware execution.
- Actions Taken: Host isolated using Elastic Defend.
4. Investigation Using osquery
Note: this example assumes that you know how to use osquery. If not, please refer to osquery | Elastic Security Solution [8.16] | Elastic.
With the host isolated, I began a detailed investigation using osquery. The goal was to identify the root cause and extent of the compromise.
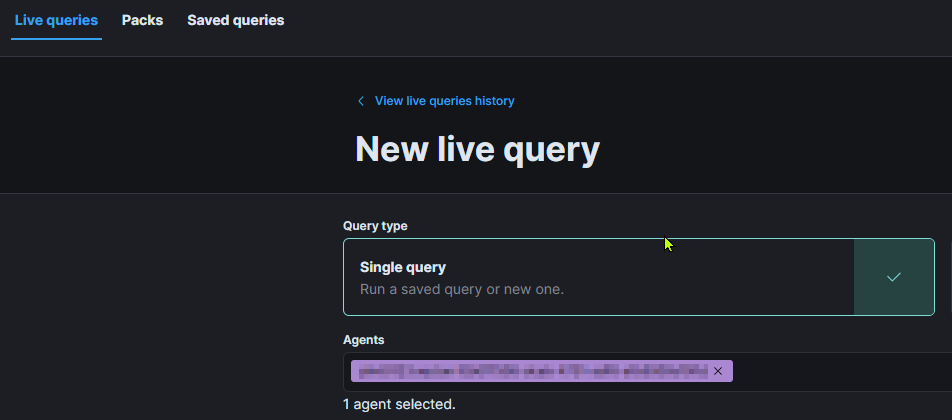
For all following queries, we want to limit results to just the host found in the alert, so choose the correct agent at query time (see the purple part under “Agents”):
Here are the investigative steps I took:
A. Check running processes:
SELECT name, path, pid, datetime(start_time, 'unixepoch', 'localtime') AS start_time
FROM processes
WHERE path LIKE 'C:\Users\%\AppData\%';
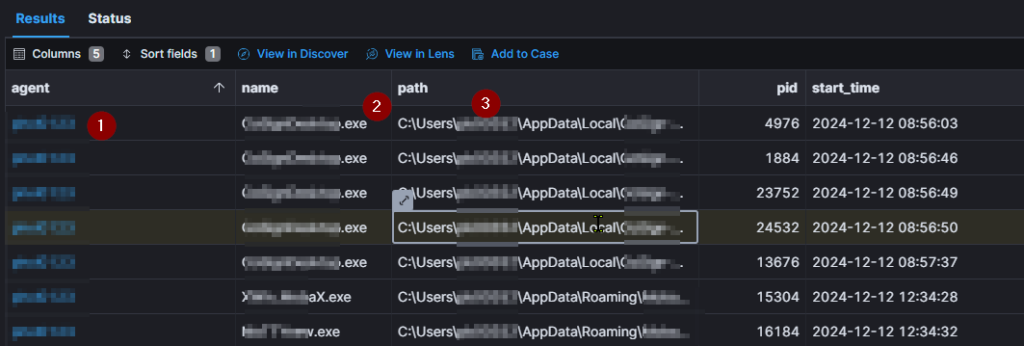
In this result one can see (1) the elastic agent which runs the process, (2) the name of the executable and (3) the path of the executable, where you can extract the username.
This query helped identify any suspicious processes running from user directories; the identified user user1234 is used in the next query.
B. List recently downloaded files and retrieve the hashes of suspicious files
SELECT path, datetime(mtime, 'unixepoch', 'localtime') AS mtime
FROM file
WHERE directory = 'C:\Users\user1234 \Downloads'
ORDER BY mtime DESC
LIMIT 10;
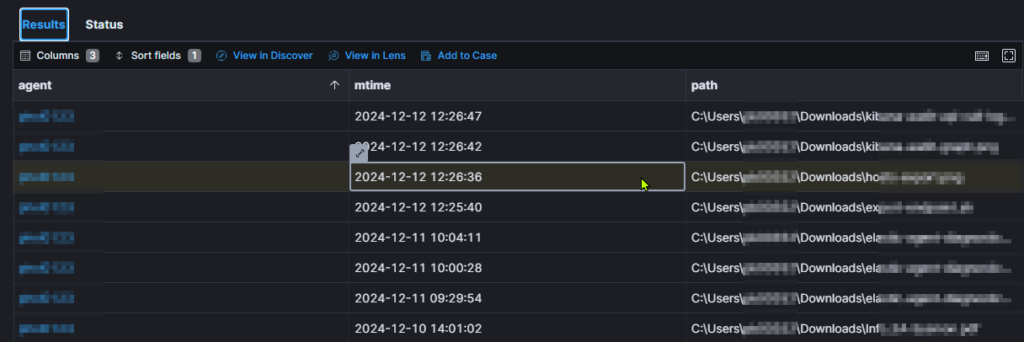
This query listed the most recently modified files in the Downloads directory, a common location for malware.
SELECT path, sha256
FROM hash
WHERE path = 'C:\Users\pb00352\Downloads\hoXXXXXX.exe';

This query finds the hash value for the suspicious downloaded file. The hash can later be appended to the blacklist as a counter measure.
C. Check for persistence mechanisms:
SELECT name, path
FROM autoexec
WHERE path LIKE 'C:\Users\user1234\AppData\Roaming\Microsoft\Windows\Start Menu\Programs\Startup\%';
This query checked for any suspicious startup items that might indicate persistence mechanisms.

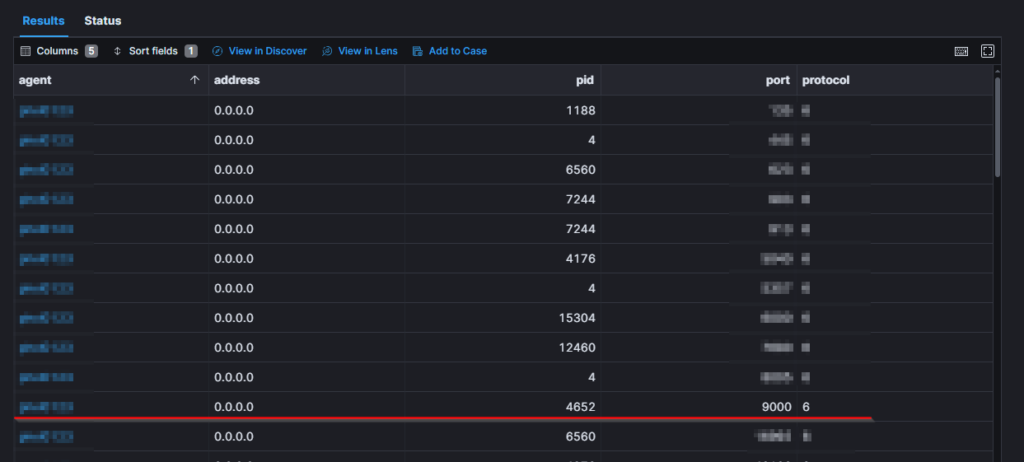
D. Network connections:
SELECT pid, local_address, local_port, remote_address, remote_port
FROM listening_ports
WHERE remote_address IS NOT NULL;
This query listed all active network connections to identify any unusual outbound traffic.
In fact, a listener on port 9000 is not normal in our environment.
5. Findings and next steps
The investigation revealed a suspicious executable in the Downloads directory, which was found to to be possible malware that opened a network listener.
Next Steps:
- Remediation: Clean the affected host and remove the malware.
- User Notification: Inform the user about the incident and steps taken.
- Review and Improve: Analyze the incident to improve detection and response strategies.
Conclusion
Today’s incident highlighted the importance of a robust security monitoring and response strategy. By leveraging tools like Elastic Security and osquery, we were able to quickly detect, isolate, and investigate the threat, minimizing potential damage.
These Solutions are Engineered by Humans
Did you learn from this article? Perhaps you’re already familiar with some of the techniques above? If you find cybersecurity issues interesting, maybe you could start in a cybersecurity or similar position here at Würth Phoenix.
Reinhold Trocker
IT professional, IT security, (ISC)2 CISSP, technical consultant
Author
Latest posts by Reinhold Trocker
15. 12. 2025
Log Management, Log-SIEM
Strange Query Results in Kibana: Understanding the Behavior of event.original and Similar Fields
20. 06. 2025
Unified Monitoring
Elastic Integration with Huge Memory Usage? Keep That Host Accessible!
29. 01. 2025
Log Management, Log-SIEM
Understanding Headers in Elastic Agents: Normal Mode vs. Fleet Server Mode