30. 06. 2026
Azure, Cloud, Microsoft, NetEye, NetEye Extension Packs, Unified Monitoring

Grazie al mio lavoro di consulente mi capita spesso di monitorare il Sistema Nutanix sui siti dei clienti. Nutanix è uno integrated systems vendor che produce un sistema di storage hyper-converged chiamato “Virtual Computing Platform”.
Monitorare questo sistema è piuttosto semplice e l’uso di NetEye permette di ottenere e visualizzare i migliori risultati.
Si può monitorare il sistema Nutanix usando il protocollo SNMP:
Per prima cosa bisogna attivare il protocollo SNMP sul lato Nutanix, dopo di che si usa check_nutanix.pl dal lato Nagios exchange, infine basta implementare il plugin su NetEye. Per poter attivare il plugin su NetEye, è necessario caricare la Nutanix MIB su NetEye. Adesso potete iniziare il Vostro monitoraggio per esempio su clusterIops, cluster latency ecc.
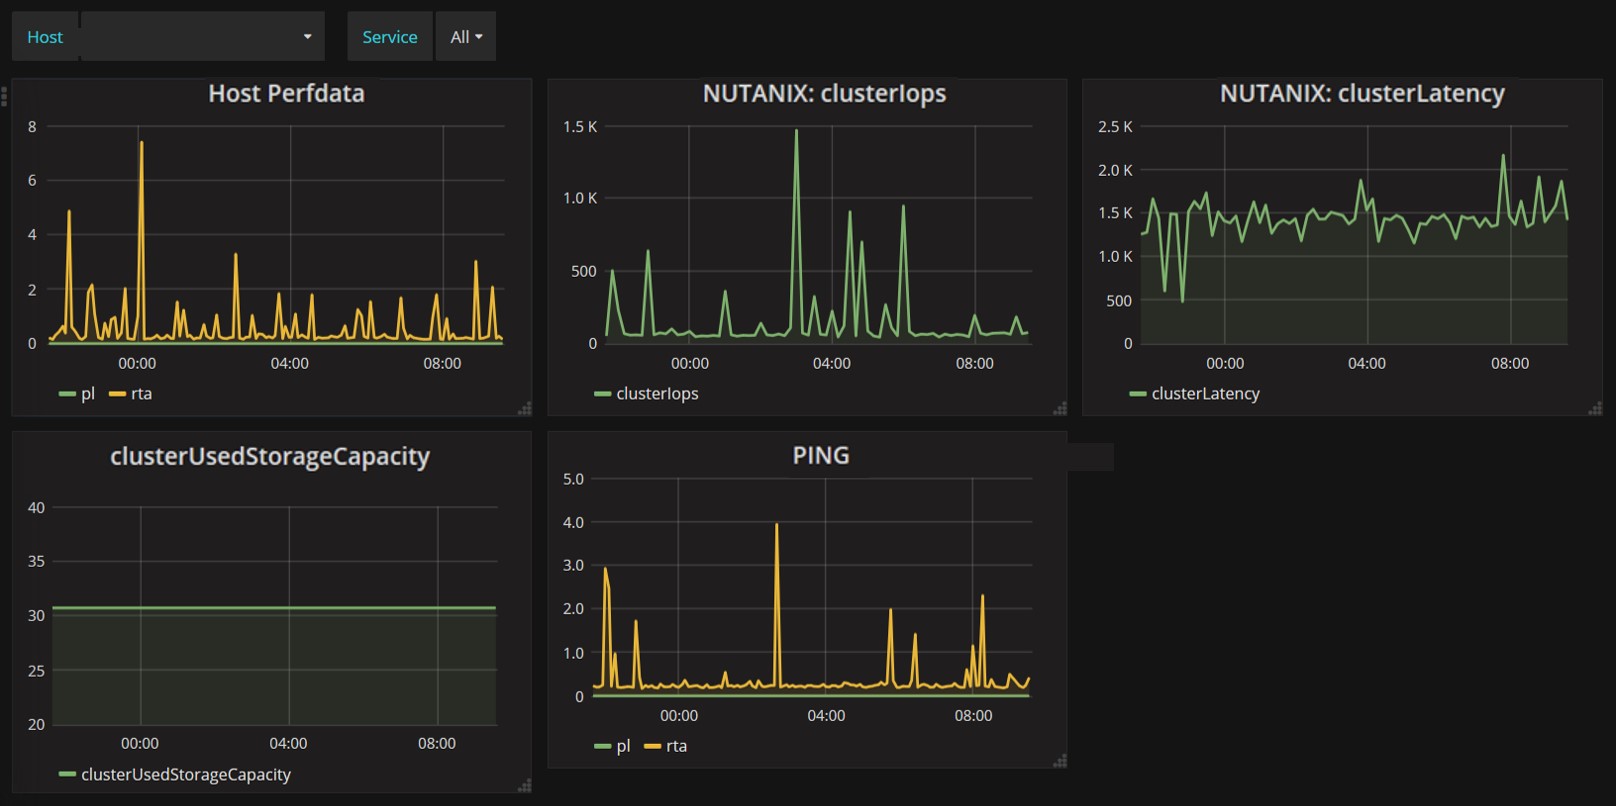
I dati prestazionali di Nutanix ottenuti tramite NetEye verranno automaticamente caricati sul database influx, cosi che possono essere visualizzate direttamente sulla dashboard di Grafana (immagine sotto);
Inoltre si possono attivare avvisi per SNMP trap sul sitema Nutanix.
Basta innanzitutto configurare il server NetEye come destination host, quindi configurare l’Eventhandler per raccogliere avvisi di SNMP trap da Nutanix, ciò cambierà lo stato del controllo passivo di NetEye. Grazie a questi avvisi potrete controllare avvenimenti che verrebbero persi durante il monitoraggio attivo.
Di seguito, verranno mostrati I possibili chek attivi e passivi per gli avvisi di SNMP trap:
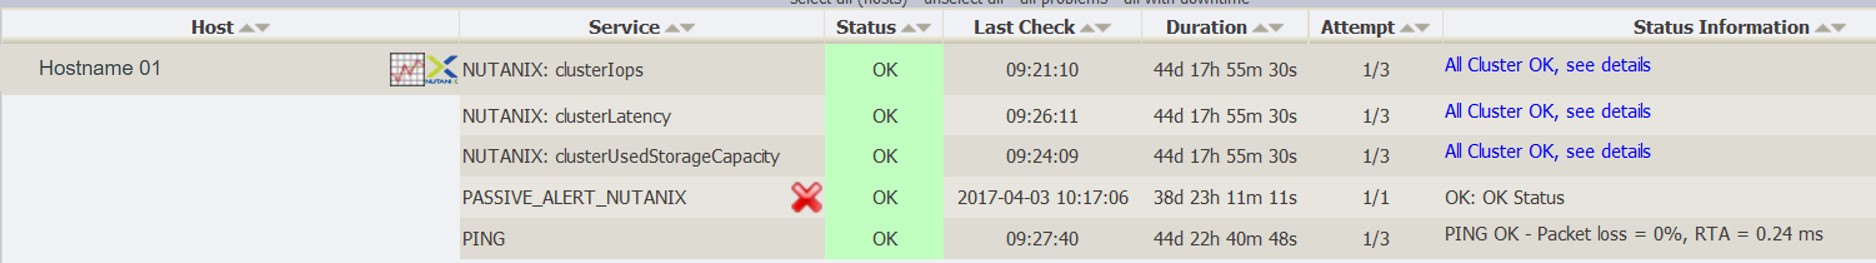
La nostra soluzione NetEye permette quindi di effetturare un monitoraggio sia passivo che attivo. E grazie alla integrazione di Grafana e Influx è possibile vedere i dati prestazionali in tempo reale.

Tobias Goller
NetEye Solution Architect at Würth IT Italy
I started my professional career as a system administrator.
Over the years, my area of responsibility changed from administrative work to the architectural planning of systems.
During my activities at Würth IT Italy, the focus of my area of responsibility changed to the installation and consulting of the IT system management solution WÜRTHPHOENIX NetEye.
In the meantime, I take care of the implementation and planning of customer projects in the area of our unified monitoring solution.
Author
Latest posts by Tobias Goller
16. 02. 2026
Unified Monitoring
OpenShift Monitoring in NetEye
13. 10. 2025
Log-SIEM, Unified Monitoring
Elastic Defend: Experiences
18. 07. 2025
Automation, Cloud
Running SOS Berlin JobScheduler in Containers: A Step Toward Cloud-Native Scheduling