
15. 05. 2018
Davide Bizzarri
APM, NetEye, Unified Monitoring
How to monitor docker containers using cAdvisor [ Part 2 ]
Introduction
In this second part of the tutorial we will create a Grafana dashboard to visualize the performance data that we have collected in the first part of the tutorial that can be found here: How to monitor docker containers using cAdvisor [ Part 1 ]
1. Create a new Data Source
The first thing we need to do is create and configure a new Data Source for Grafana.
- Click on the Grafana icon at the top left
- From the drop down menu, select Data Source
- Then click on Add data source
- Fill in the Data Source as in this screenshot (password: root)
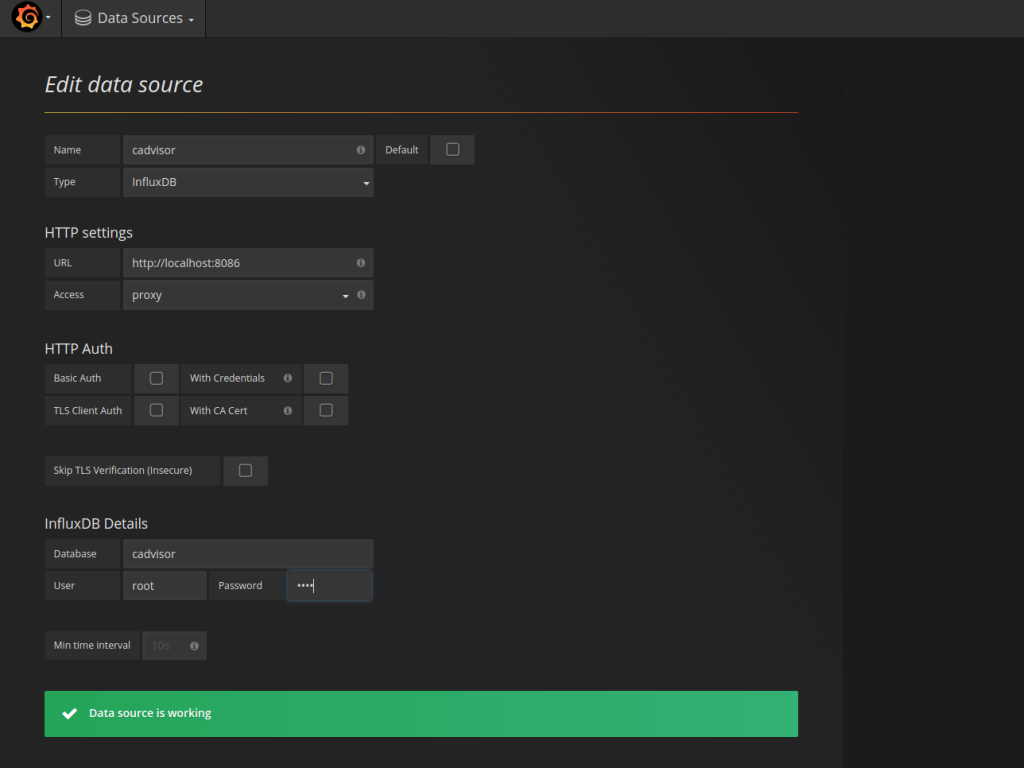
The configuration of the Data Source can be different if you are not using NetEye.
- Finally, click on Save & Test

2. Create a new Dashboard
Now we are going to create a new dashboard to visualize the disk usage of our docker host machine.
- Click on the Grafana icon at the top left
- From the drop down menu, select Dashboards
- Then click on New
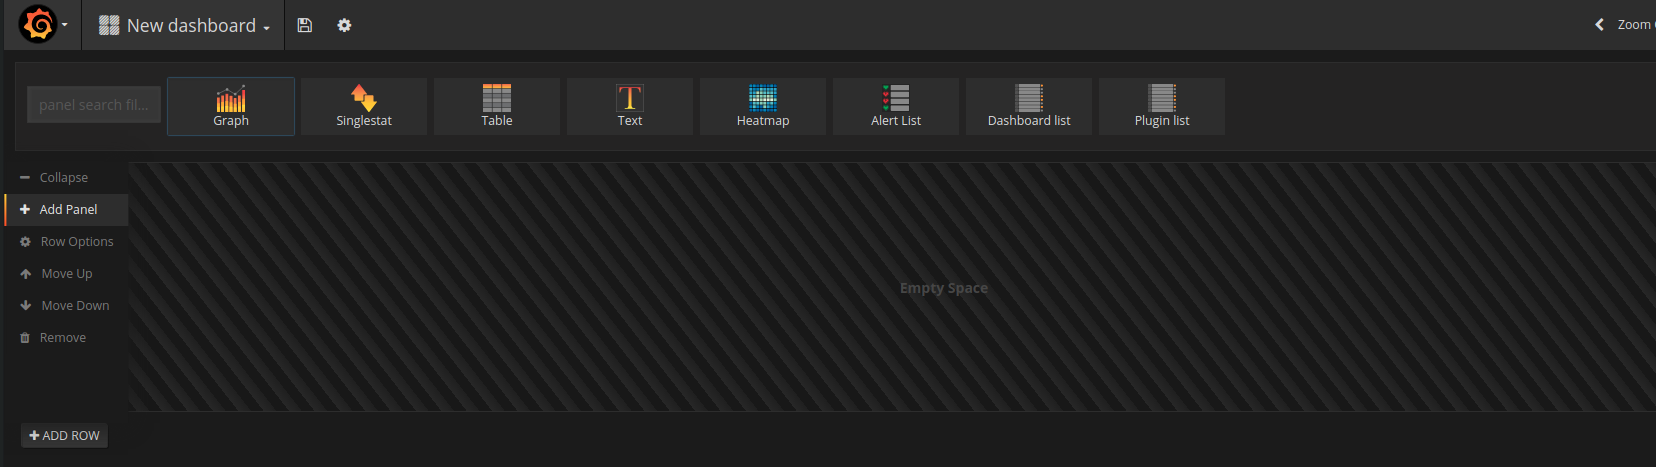
- From the new page, click on Add Panel
- Then select Graph from the menu strip above the empty panel
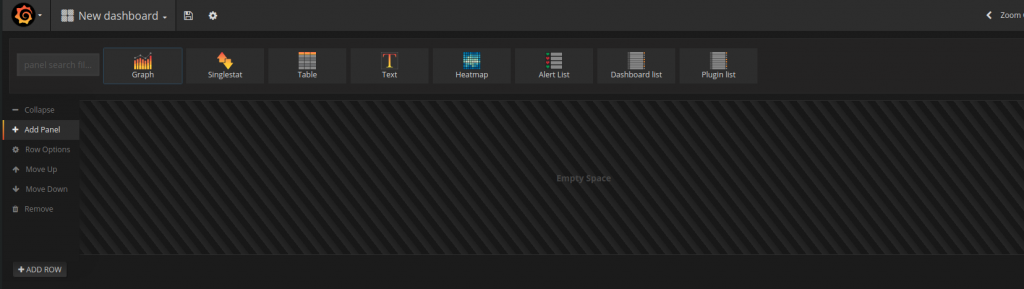
- Click on the title of the new Graph and select Edit.
- Now create the new metrics with the parameters as in this screenshot:
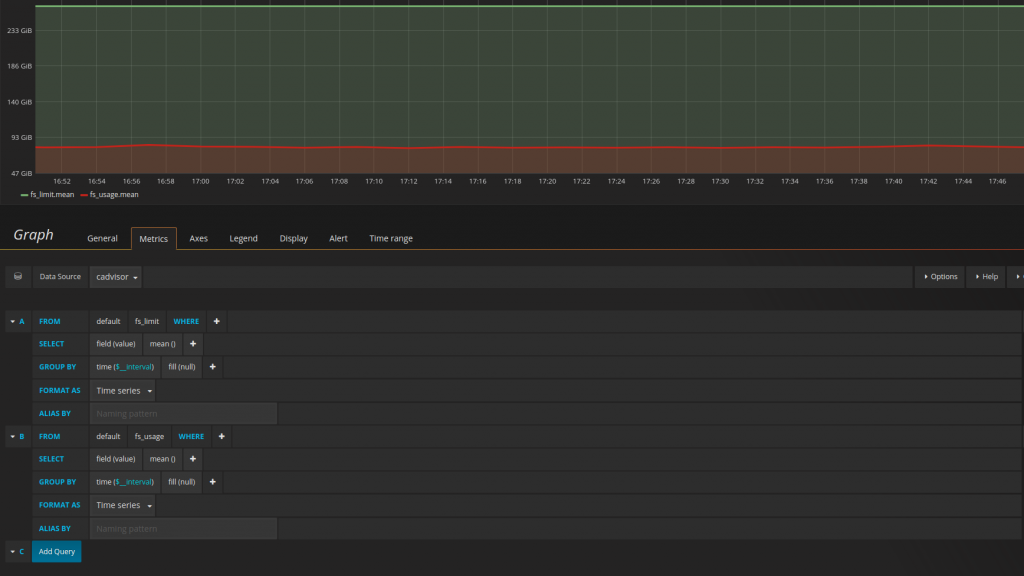
- We can edit the title of the Graph from the General tab.
- We can select bytes as unit for our Metrics from the Axes tab.
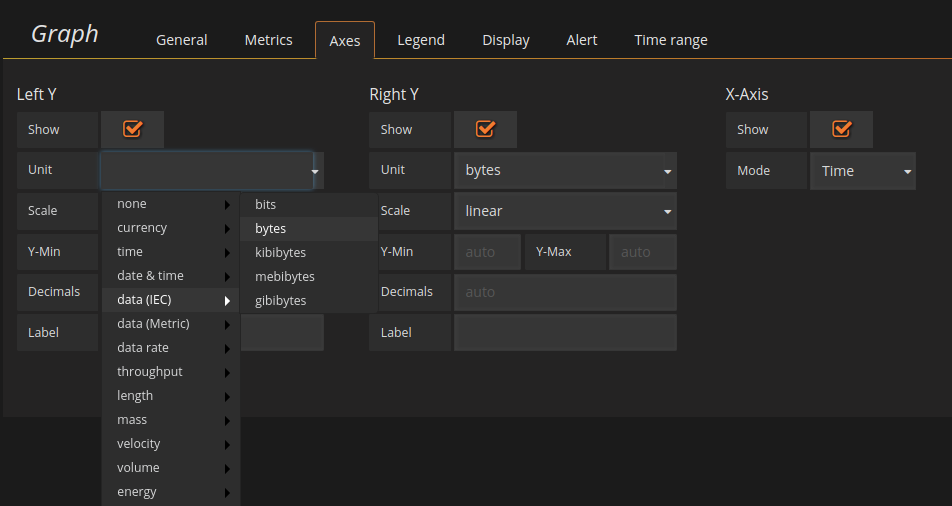
- Finally we can save our dashboard by clicking on Save at the top of the page.

Conclusions
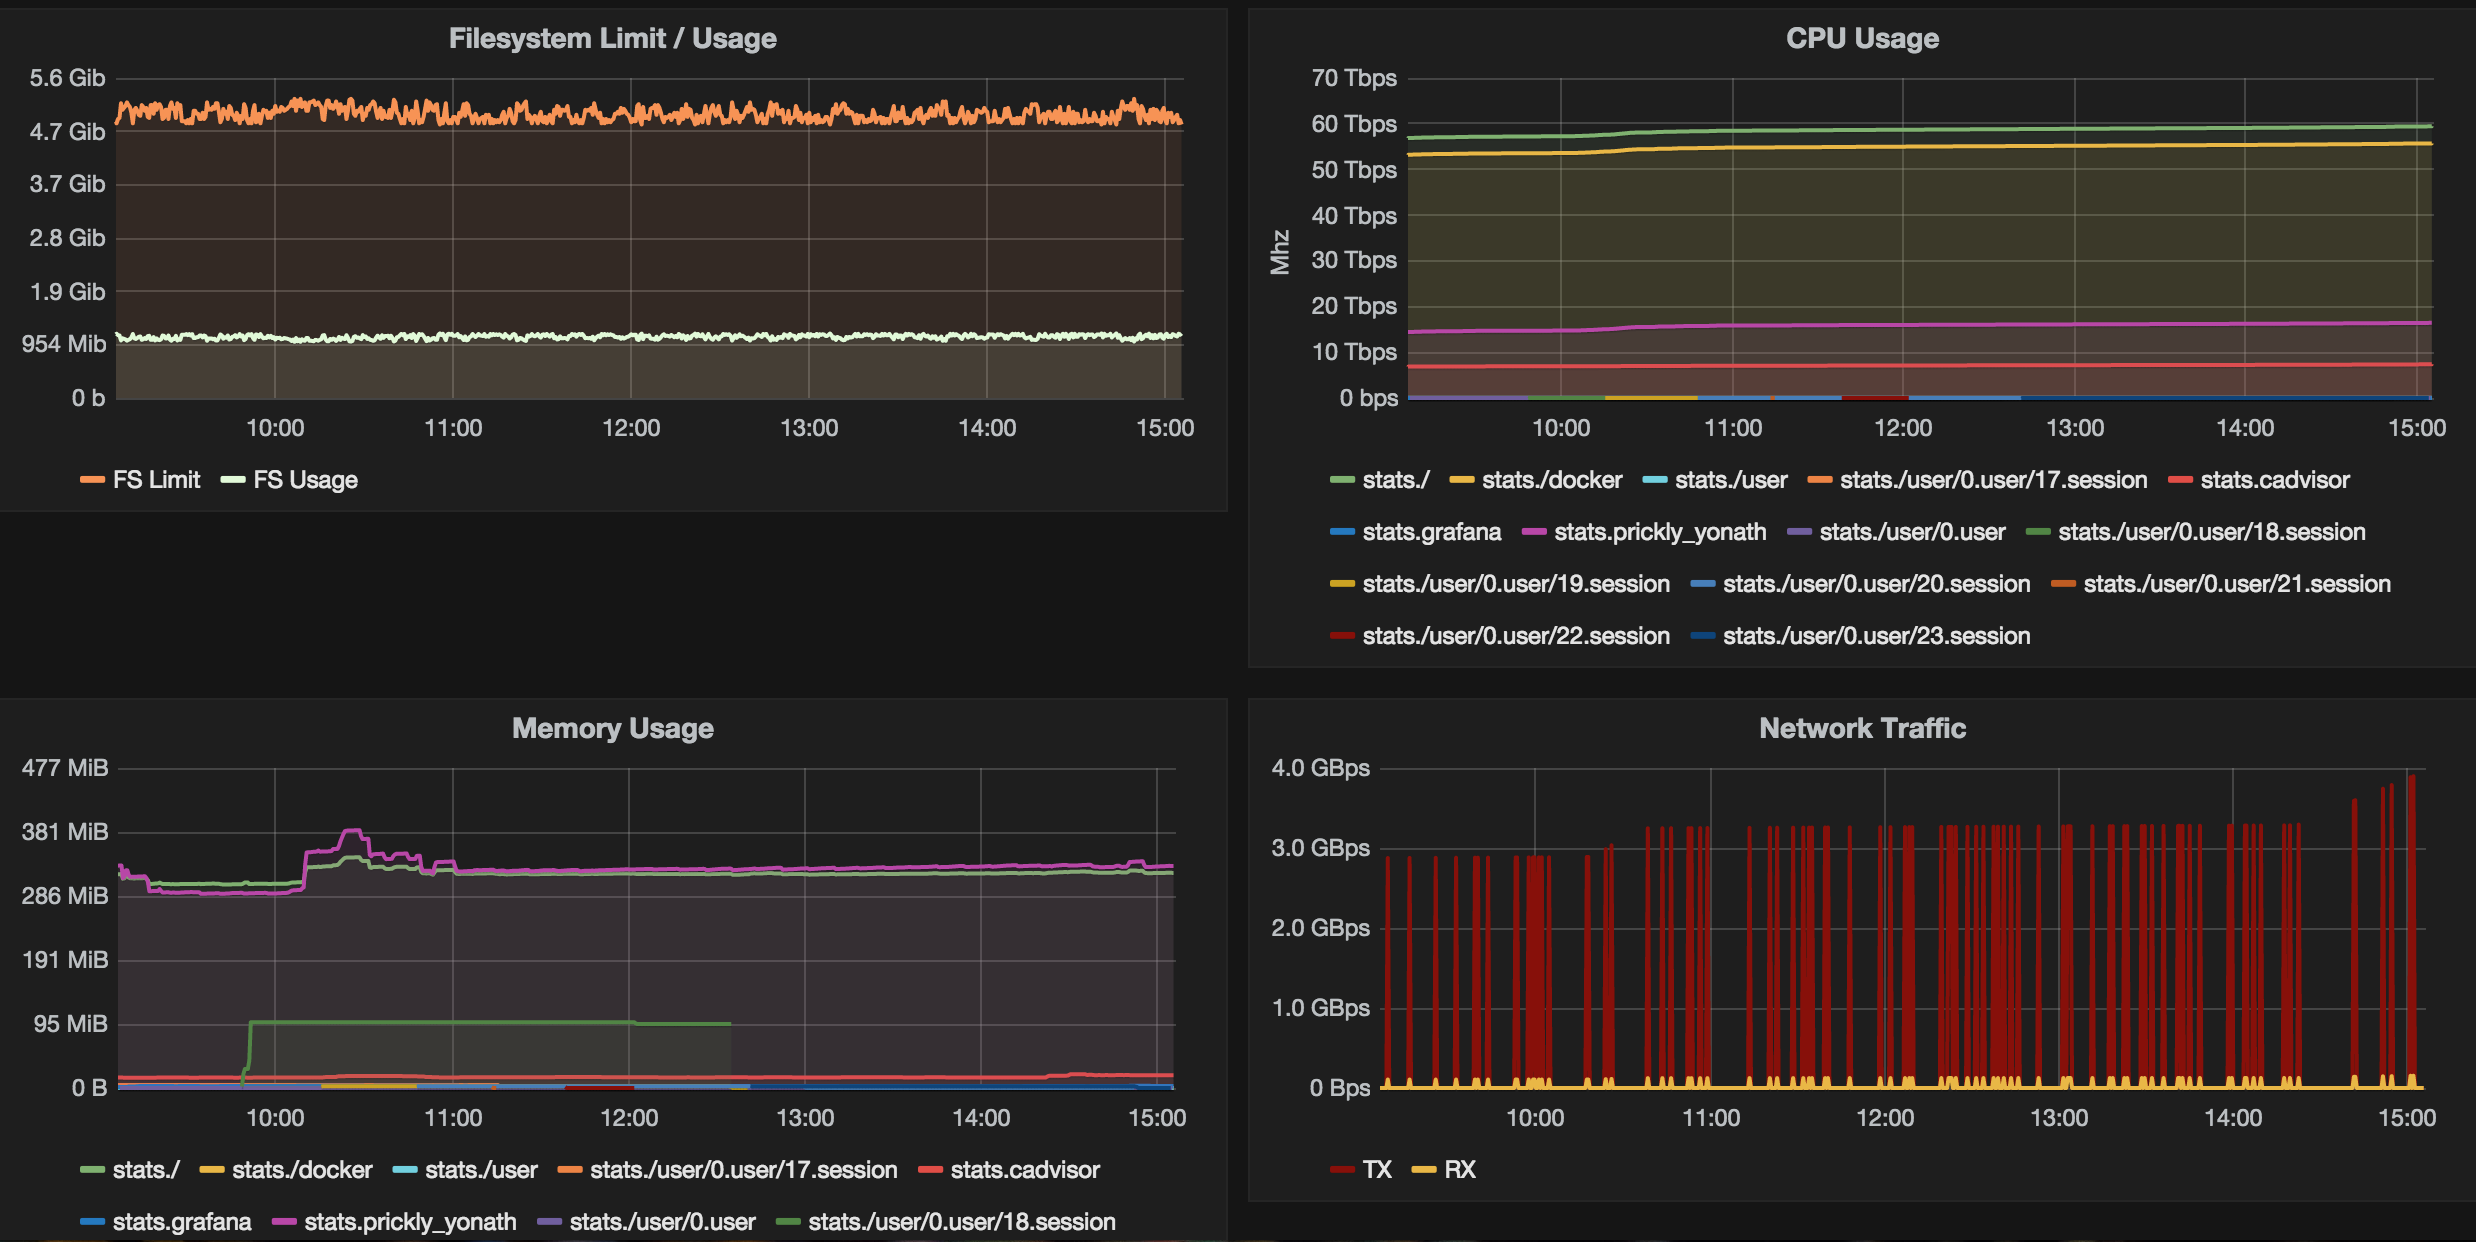
In this tutorial we have seen just one example, but it’s possible to create graphs to visualize CPU usage, memory usage and network traffic. You can find more examples here: Docker Monitoring.

Davide Bizzarri
R&D Software Engineer at Würth Phoenix
Hi, I'm Davide! I’m a full stack developer at Würth Phoenix. I started to use a PC at the age of ten when my parents bought our first family PC: an old Windows 98. Then, in high school, my professor introduced me to the world of software development by teaching me my first programming language, C. Since then I began to study IT and programming languages alone. After one year, I started to develop my first website that reached over one thousand views per day. Once I finished high school, I changed my job twice, until Würth Phoenix has hired me. Here I have learned many interesting things, one of the most important once is the agile development methodology which we living every day.
Author
Latest posts by Davide Bizzarri
05. 03. 2018
Downloads / Release Notes
NetEye 3.12 Packages Updates