30. 06. 2026
Asset Management, GLPI, Service Management

Scenario
GLPI is integrated into NetEye and provides powerful asset management solutions.
Usually GLPI agents are deployed on servers and clients: this way an up-to-date asset inventory is kept within NetEye.
The GLPI package also provides a tool able to perform network SNMP scans, detecting for example network printers, switches, and routers, as well as a tool aimed at inventorying VMware vCenter and/or ESXi.
These tools can be scheduled to run on any server, but the best place to run them is on a NetEye satellite, because it already has its firewall configuration ready for SNMP discovery, which is used also by the Icinga 2 monitoring part.
Data Collected
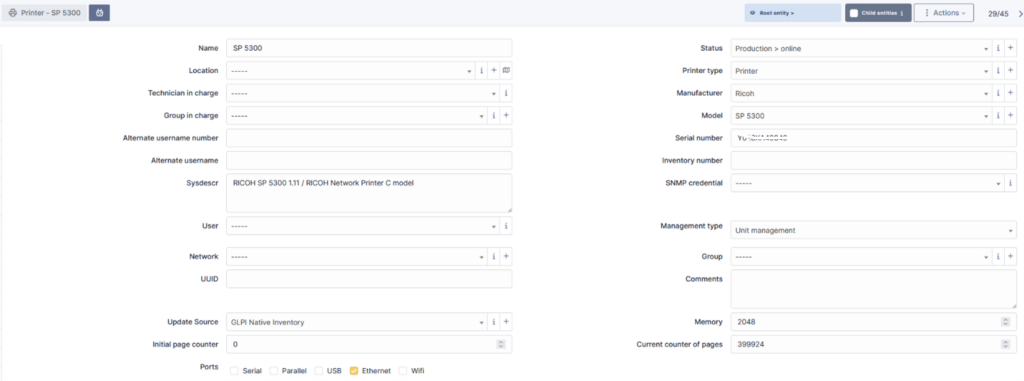
The GLPI net SNMP discovery is able to collect a lot of useful information from the printers: for example, the complete hardware configuration, toner status, and so on.
Here’s an example of the data retrieved for a printer:

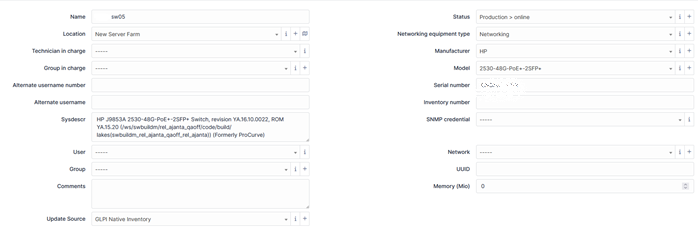
And here’s an example of a network switch:
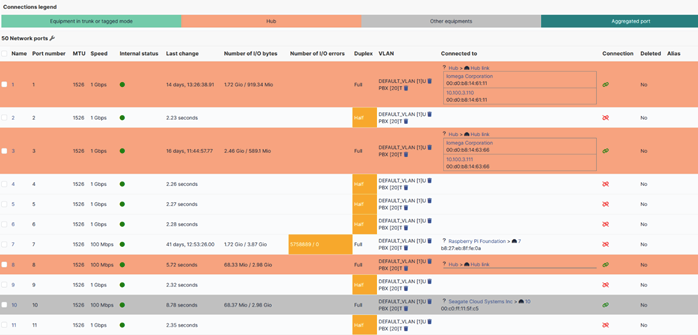
with its related interface status:
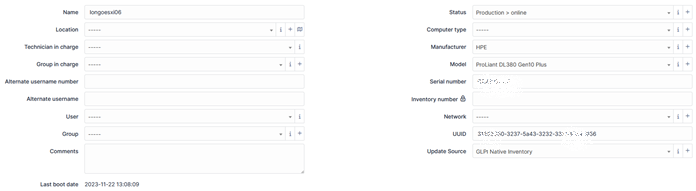
The GLPI ESX inventory is mainly used against a VMware vCenter: it’s able to collect the entire VMware farm configuration, ESXi hypervisors connected to the vCenter, and the configured VMs.
For example here’s an ESXi status:
with all the VMs running on this ESXi:
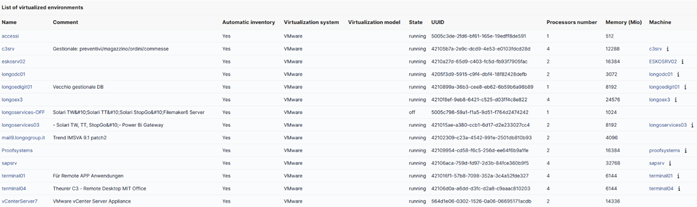
The inventoried VM is automatically linked to a computer GLPI object if there has already been an inventory performed through a local installed agent (see the links in the Machine column on the far right side).
How to Set Up the GLPI Network Inventory
The GLPI network discovery process requires several Perl modules.
On a NetEye satellite, the following modules must be installed:
perl-Parallel-ForkManager perl-Socket-GetAddrInfo perl-UNIVERSAL-require perl-Proc-Daemon perl-Archive-Extract perl-Net-NBName
GLPIi must be installed using the Perl script provided by the GLPI website: It’s important to install all the components.
perl glpi-agent-x.x.x-linux-installer.pl --no-httpd --no-p2p --type=all
The GLPI SNMP network discovery process must be manually launched. One way to automate it is through a cronjob.
A typical SNMP discovery command will be:
/usr/bin/glpi-netdiscovery --first <FIRST_IP_ADDR_TO_SCAN> --last <LAST_IP ADDR_TO_SCAN> --v <SNMP_VERSION> --community <COMMUNITY_NAME> --community <COMMUNITY_NAME_IF_MORE_THEN_ONE> --timeout 10 --threads 50 -i -s /tmp
This will produce several XML files under /tmp/netinventory folder, one for each device. There’s a similar command for a vCenter or ESXi GLPI inventory:
/usr/bin/glpi-esx --host <VCENTER_IP_ADDR> --user <VCENTER_READONLY_USER> --password <VCENTER_READONLY_USER_PASSWORD> --path /tmp/esxinventoryFinally, all the generated XML files must be imported into the GLPI service using the GLPI injector command:
/usr/bin/glpi-injector -d /tmp/netinventory -u https://<Satellite.CUSTOMER_LOCAL_DOMAIN>:443/glpi/front/inventory.php

Alessandro Romboli
Site Reliability Engineer at Würth IT Italy
My name is Alessandro and I joined Würth Phoenix (now Würth IT Italy) early in 2013. I have over 20 years of experience in the IT sector: For a long time I've worked for a big Italian bank in a very complex environment, managing the software provisioning for all the branch offices. Then I've worked as a system administrator for an international IT provider supporting several big companies in their infrastructures, providing high availability solutions and disaster recovery implementations. I've joined the VMware virtual infrastructure in early stage, since version 2: it was one of the first productive Server Farms in Italy. I always like to study and compare different technologies: I work with Linux, MAC OSX, Windows and VMWare. Since I joined Würth Phoenix, I could also expand my experience on Firewalls, Storage Area Networks, Local Area Networks, designing and implementing complete solutions for our customers. Primarily, I'm a system administrator and solution designer, certified as VMware VCP6 DCV, Microsoft MCP for Windows Server, Hyper-V and System Center Virtual Machine Manager, SQL Server, SharePoint. Besides computers, I also like photography, sport and trekking in the mountains.
Author
Latest posts by Alessandro Romboli
17. 06. 2026
Microsoft
UEFI Secure Boot Nightmare
03. 12. 2025
Microsoft
Single Sign-On for Power BI Report Server
08. 09. 2025
Service Management
VMware ESXi Transparent Page Sharing
12. 06. 2025
Microsoft
Terminal Server User Profiles with FSLogix