24. 09. 2026
Automation, Development, DevOps

29. 09. 2026
Guglielmo Fortuni
Atlassian, NetEye, Unified Monitoring
From NetEye Cloud Alerts to Customer Tickets: Automating the Workflow with Jira Operations and JSM
In my previous posts of this series, we explored how to handle, filter, route, and enrich alerts generated by NetEye and forwarded to Jira Operations:
In this article, I’ll show you how we automated the creation of customer tickets from relevant NetEye Cloud monitoring events. The workflow transforms Icinga notifications into Jira Operations alerts and then creates properly categorized Jira Service Management (JSM) tickets, ensuring that every event and customer interaction remains fully traceable.
I’ll present our use case and implementation, which may also provide useful ideas for similar configurations and automation workflows.
The Use Case
Our goal was to turn relevant NetEye Cloud monitoring events into fully traceable Jira Service Management tickets rather than sending individual Icinga notifications. Each ticket had to be created in the appropriate space, categorized with the correct customer and contract, assigned to the relevant contacts, and linked to both the Jira Ops alert and the affected NetEye object.
In summary, the workflow had to:
- Create a Jira Service Management ticket from a relevant NetEye Cloud alert
- Associate the ticket with the correct customer and contract
- Assign the appropriate customer contacts
- Include all the monitoring information required for troubleshooting
- Link the ticket to both the Jira Ops alert and the affected NetEye object
- Notify the customer automatically
- Allow a NOC operator to investigate and manage the issue when manual intervention is required
- Keep the alert and ticket lifecycles synchronized through to resolution
The Chosen Solution: Two Connected Automations
We initially considered using Jira Operations Sync or creating the ticket directly through a Jira Ops automation. However, these options didn’t provide all the functionality required for our use case, particularly for querying Assets, retrieving customer and contract information, and fully configuring the ticket.
For this reason, we implemented two separate automations:
- The first automation runs in Jira Operations. It’s triggered when a matching alert is created and sends the relevant alert information through a webhook.
- The second automation runs in the dedicated JSM space. It receives the webhook, then queries Assets, creates and categorizes the ticket, adds the customer contacts, and sends the initial customer notification.
NetEye Cloud monitoring event
            ↓
Icinga notification
            ↓
Jira Operations alert
            ↓
Automation 1 (Jira Ops):
        collect alert data
                ↓
        send webhook
                ↓
        Automation 2 (Jira JSM):
                  triggered by webhook
                      ↓
                  query asset
                      ↓
                  Create and categorize the JSM ticket
                      ↓
                  Add customer contacts
                      ↓
                  Notify the customer
                      ↓
                  NOC investigation, if required
Implementation
1. NetEye and Icinga Configuration
The workflow starts with a customized Icinga notification configured for the relevant hosts and services through dedicated filters. When one of these monitoring objects meets the defined conditions, Icinga sends a notification containing the required object information, custom variables, and tags to Jira Operations, where the corresponding alert is created.
2. Preparing the Jira Operations Alert
The alert created in Jira Operations contains the monitoring details received from Icinga.
In addition, we use tags and alert properties to properly declare:
- The customer associated with the event
- The affected host and service
Using structured and predictable values is important because the same information will later be passed to the Jira Service Management automation, and we ensure that each alert contains a unique reference to the affected NetEye object.
3. Jira Operations Automation
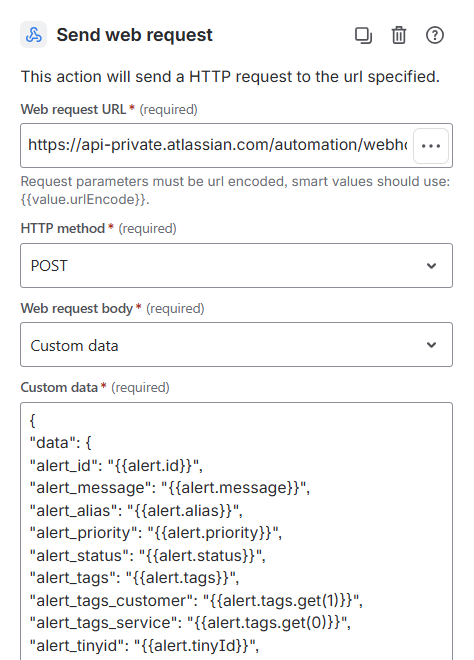
The first automation is configured in Jira Ops and is triggered by alert creation. It collects the necessary information from the alerts using Jira smart values, and include these in the outgoing webhook body.
The automation then executes a Send web request action, where the destination is the incoming webhook URL configured in the second automation in the Jira Service Management space.
A webhook payload will have a structure similar to the following:
{
"data": {
"alert_id": "{{alert.id}}",
"alert_message": "{{alert.message}}",
....
"alert_alias": "{{alert.alias}}",
"alert_tags_customer": "{{alert.tags.get(1)}}",
"alert_tags_service": "{{alert.tags.get(0)}}",
"alert_servicedesc": "{{alert.extraProperties.noc_service_name}}",
....
"alert_host_name": "{{alert.extraProperties.host_name}}",
"alert_object_type": "{{alert.extraProperties.object_type}}",
"alert_servicestate": "{{alert.extraProperties.service_state}}"
}
}
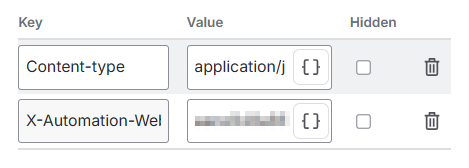
In the screenshot you can see the web request configuration to send the webhook. Notice that you’ll need to properly configure the header X-Automation-Webhook-Token with the pre-shared secret .
4. Jira Service Management Automation
The second automation runs in the Jira Service Management space where the customer ticket must be opened. It receives the webhook, queries Assets, creates and categorizes the ticket, adds customer contacts, and sends the initial customer notification.
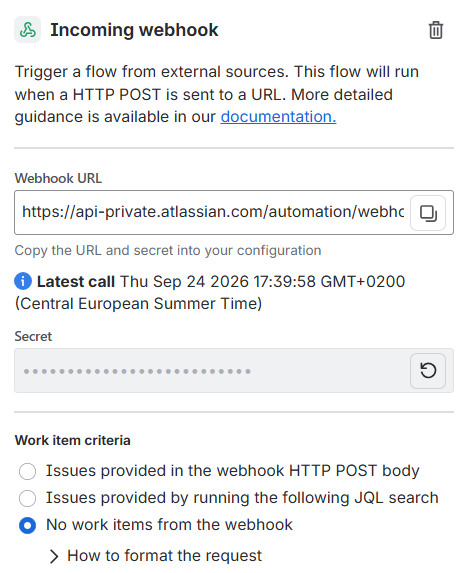
a) Configuring the Incoming Webhook in Jira Service Management
The incoming webhook configuration provides a dedicated endpoint and secret. These values are used by the Send web request action in Jira Ops automation to trigger the rule.
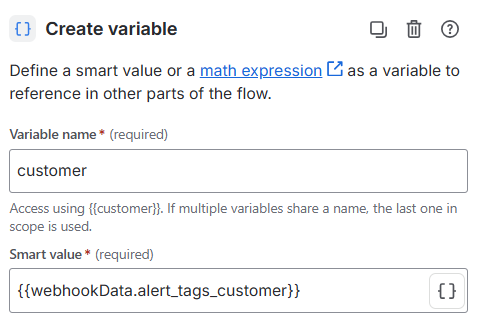
The webhook body contains the alert information collected during the previous step, these values can be accessed using webhook smart values.
Incoming webhook configuration:
Smart value – Variable creation :
b) Retrieving Customer Information from Assets
Before creating a ticket, the automation queries Jira Assets using the Lookup objects action to identify the correct customer company and active contract.
The query is similar to the following:
objectType IN ("WG3956 - Contract Position") AND "CMDB Status" IN ("Active") AND Customer LIKE {{customer}} AND Name LIKE "<contract_name>"
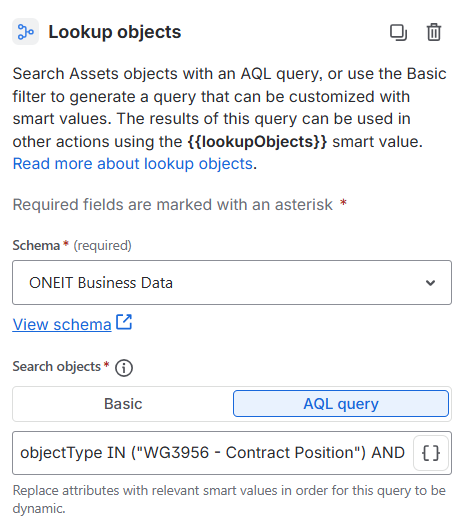
The lookup result provides the customer and contract information required to continue the workflow, create the ticket, and populate the corresponding categorization fields correctly.
c) Creating and Categorizing the Customer Ticket
After retrieving and validating all required information, the automation creates the Jira Service Management ticket using the appropriate request type:
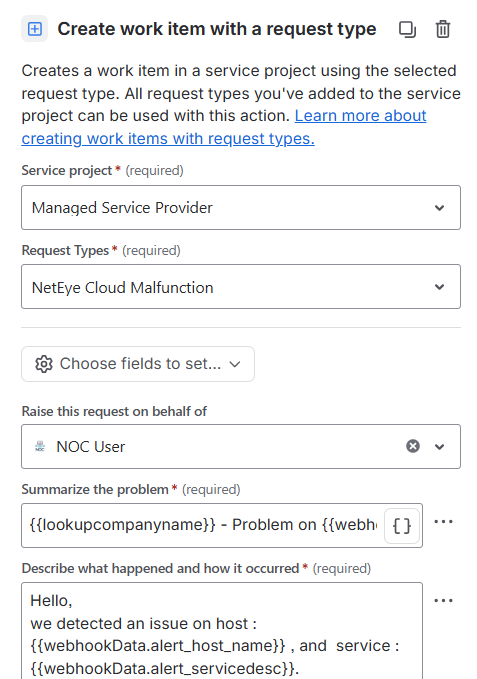
The ticket is then categorized by populating:
- The customer company
- The customer main contact
- The relevant contract
d) Adding the Customer Contacts
The customer contacts are also retrieved from Assets using lookup objects. The automation uses these values to configure:
- The ticket reporter
- The request participants
The reporter represents the primary customer contact associated with the request, while request participants allow other configured contacts to receive updates and interact with the ticket.
Adding multiple request participants requires an additional step to convert the query results into a format accepted by the Request Participants field. I use the following smart value to build a list of Jira account IDs:
{{#lookupObjects}}
{ "accountId": "{{AccountId}}" }{{^last}},{{/last}}
{{/lookupObjects}}
This value is stored in an automation variable called accountIDlist. The {{^last}},{{/last}} expression adds a comma after each object except the last one, producing a valid comma-separated list.
The variable can then be used to populate the Request participants field:
{
  "fields": {
    "Request participants": [
      {{accountIDlist}}
    ]
  }
}
e) Sending the Initial Customer Notification
Once the ticket has been created, categorized, and assigned to the correct contacts, the automation adds a public comment that notifies the customer with the relevant data.
f) Linking the Ticket, Alert, and NetEye Object – Acknowledge Event
Through automation and alert properties, we link the three main objects involved in the workflow:
- NetEye monitoring object
- Jira Operations alert
- Jira Service Management ticket
The ticket contains:
- A direct link to the Jira Operations alert
- A direct link to the affected object in NetEye Cloud
The Jira Ops alert is also updated with:
- The new ticket key
- The ticket URL
In our implementation, some of these actions were not available as preconfigured automation components. We therefore used Jira Ops and JSM REST API requests.
With this request for example we post a comment on the alert from the JSM Automation.
URL:
https://api.atlassian.com/jsm/ops/api/<JiraOps_CloudID>/v1/alerts/{{webhookData.alert_id}}/notesBody:
{
  "note": "Created  ticket to notify customer: {{createdIssue.key}} , {{createdIssue.url}} "
}
With this web request, instead, we link the alert to the created ticket via a URL like:
https://api.atlassian.com/jsm/incidents/cloudId/<JSM_CloudID>/v1/incident/{{issueid}}/alert/addand having a body like:
{
  "alertIds": [
    "{{webhookData.alert_id}}"
  ]
}
After the ticket has been created successfully, the Jira Operations alert is acknowledged with a POST web request to the URL:
https://api.atlassian.com/jsm/ops/api/<JiraOps_CloudID>/v1/alerts/{{webhookData.alert_id}}/acknowledgeThe Jira Ops integration is configured to forward acknowledgements back to NetEye through the Jira Edge Connector. As a result, the corresponding Icinga host or service is also acknowledged and a comment containing the newly created ticket link is added to the monitored object.
5. Closing the Alert and Customer Ticket
Ticket creation is only half of the workflow. The automation must also handle recovery.
When Icinga detects that the monitored object has returned to a healthy state, it sends an OK notification to Jira Operations and this closes the alert.
Closing the alert triggers a second automation flow, similar to the one used for ticket creation. A Jira Ops automation sends a webhook that is received by an automation in Jira Service Management. Using the alert properties included in the request, the automation identifies the corresponding ticket, adds a public comment to inform the customer that the problem has been resolved, and then closes the ticket.
For this workflow, the incoming webhook trigger is configured with the “Issues provided in the webhook HTTP POST body” option, allowing the automation to retrieve and process the ticket directly from the webhook payload:
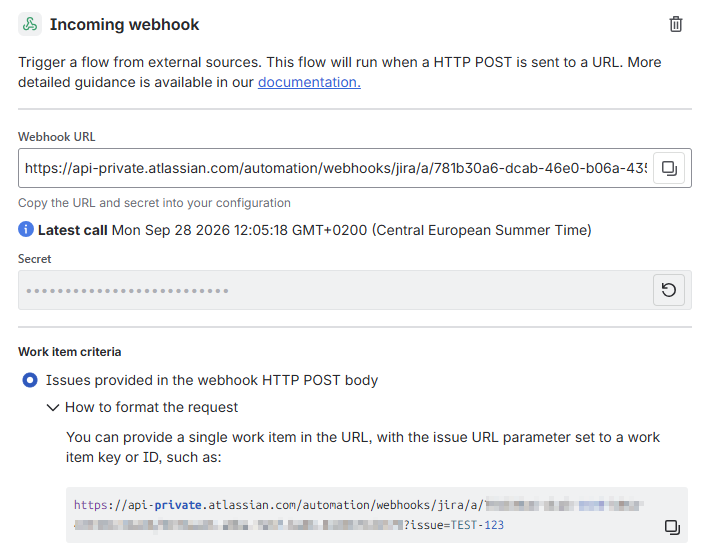
Storing the ticket key in the alert extra properties during the creation flow makes this step much easier. The closure automation can directly retrieve the corresponding ticket instead of trying to reconstruct the relationship from the title or search for it using less reliable criteria.
Final Result
With the complete workflow in place, a NetEye Cloud monitoring event can automatically create a fully categorized customer ticket without requiring manual intervention.
At the same time, the Jira Operations alert is acknowledged, linked to the ticket, and synchronized back to the corresponding Icinga object in NetEye.
NOC operators can assign the ticket, continue troubleshooting, and interact with customers as needed.
When the monitoring object recovers, the alert is closed, the customer receives a resolution update, and the ticket is transitioned to its final status.
This two-automation model has allowed us to keep the responsibilities clearly separated. Jira Operations manages the alert lifecycle and monitoring context, while Jira Service Management manages customer information, ticket categorization, assets, and communication.
With this final how-to, our series dedicated to Jira Operations comes to an end. I hope you found these articles useful and that the practical examples provided some interesting ideas for your own alert management and automation workflows.
These Solutions are Engineered by Humans
Did you find this article interesting? Are you an “under the hood” kind of person? We’re really big on automation and we’re always looking for people in a similar vein to fill roles like this one as well as other roles here at Würth IT Italy.

Guglielmo Fortuni
Hello! I'm Guglielmo, a NOC Engineer within the Service & Support / NOC Team at Würth IT Italy. I specialize in customer support and in the management and monitoring of our MSP monitoring platform, NetEye Cloud. My daily work is focused on ensuring service continuity, optimizing alerting workflows, and improving monitoring efficiency for our customers.
Author

Latest posts by Guglielmo Fortuni
25. 03. 2026
Atlassian, NetEye, Unified Monitoring
Jira Operations Tips & Tricks for NetEye Users – Part 1