10. 07. 2026
APM, Log Management, Log-SIEM

27. 06. 2026
Csaba Remenar
Log Management, NetEye
When Postfix Can No Longer Remain Invisible: More Transparent Debugging with Elastic
Postfix is not typically the first component that comes to mind when talking about critical services. And yet it’s through Postfix that all notifications, ticketing system-related correspondence, and monthly SLA reports are sent out from NetEye. As long as everything is working properly, Postfix is almost invisible. And that’s exactly what it does: silently and reliably deliver messages.
The problem starts when someone doesn’t receive a report, or an alert arrives late. In such cases, it’s no longer enough to know that the system has sent the message. You need to see exactly what happened to it. However, traditional, local log-based troubleshooting becomes difficult to maintain above a certain load.
When Local Logs Were No Longer Enough
In NetEye, Postfix is not an isolated mail component. It’s a shared service that supports several business and operationally important processes. It’s worth briefly going through the three areas that clearly show why better visibility is so important.
NetEye notifications
The first and one of the most important areas is the email notifications that come out of NetEye. These are essential parts of daily operations, and therefore represent a particularly sensitive area. If some messages are late, don’t arrive, or an anomaly is discovered late, it’s not only a technical problem, but also a problem from a monitoring perspective.
Ticketing-related emails – Erizone
Erizone is a ticketing system that’s not directly part of NetEye, but is nonetheless a defining element in our own infrastructure. This system is used by the Operating team in their daily work. At the same time, it’s closely connected to NetEye, and tickets are automatically opened via email notifications, which are then processed by the Operating team.
If an error is reported or a case arises where this process is affected, it’s important to know whether the system actually sent the given message, what status it was processed with, whether it was forwarded, whether there was a deferred status, or whether an SMTP response was received. If this data is difficult or not completely reliable to access, it directly impairs our ability to investigate errors.
Reports that must arrive
Although it’s not critical if an SLA report fails to be sent, as it can be regenerated and sent again, it’s not enough to simply tell a user that “we have sent it in principle”. If someone indicates that they did not receive the monthly report, for example, we must be able to look into what actually happened.
When Local Troubleshooting Is Not Enough
The previous approach to troubleshooting was fundamentally simple: We, looked at /var/log/maillog and, if necessary, the contents of /var/log/messages, and then tried to piece together the chain of events by hand. This can be a perfectly workable method for smaller volumes. However, in a more complex and noisy environment, its limitations become increasingly apparent.
One problem is searchability. Searching for a specific event, sender, recipient, or queue ID in a large log file is time-consuming and cumbersome. Another problem is the lack of context: related lines, statuses, and responses often have to be pieced together manually. The third, more important limitation is that troubleshooting based on local logs can also become unreliable with large message volumes.
This was best illustrated by a specific incident. The problem was triggered by a small bug in a Python script that generated a large number of ABRT (Automatic Bug Reporting Tool) error messages in the /var/spool/mail/nobody mailbox. The nobody mailbox is typically the local mailbox of an unprivileged system account that does not belong to a real user, but is often used by background processes or system components as a default recipient.
Because it’s rarely checked during normal operations, a large amount of unexpected mail can accumulate there without being noticed. Once the account reached its 50 MB quota, the system does not receive any more messages, and new messages will pile up in the local mail queue. Since the traces of the events were recorded in the /var/log/messages file, which was not constantly monitored, the process remained hidden from operation.
The situation became critical when the rsyslog rate limit came into effect due to the large number of accumulated messages, with the following configuration:
Ratelimit.Interval="600"Ratelimit.Burst="20000"
This limitation basically serves to protect the system against sudden storage saturation caused by log data flooding. However, after reaching the limit of 20,000 every ten minutes, the system permanently discarded all further entries. The situation was aggravated by the fact that a complaint was received during this period regarding a missed SLA report and a delivery error related to the EriZone ticketing system.
Since the maillog entries needed for investigation were missing or only partially available due to the limit, the discovery of errors was seriously hampered. The question may arise as to why we didn’t simply increase the local limit. This has its own risks: keeping more messages locally can increase disk load, lead to faster consumption of storage space in /var/log, cause new operational problems, and make searching even more difficult.
Why Did We Move Towards Centralization?
The solution was to introduce raw Postfix logs into the Elastic environment. It’s important to emphasize that the logs are not sent directly to Elasticsearch for now. They are still written to the log files, and then the Elastic Agent reads and forwards them.
You may wonder whether if the rate limit comes into effect again, these logs will not be sent to Elastic either. Yes, this is indeed the case, but there is an important difference that makes this approach much more usable, as I discuss now.
How did we build our solution?
As I wrote above, the Elastic Agent monitors the log files and forwards the data to Elastic. This can be installed very easily: A new “Custom Logs” integration needs to be added to the policy of the NetEye operational nodes, and then logs immediately begin to be collected.
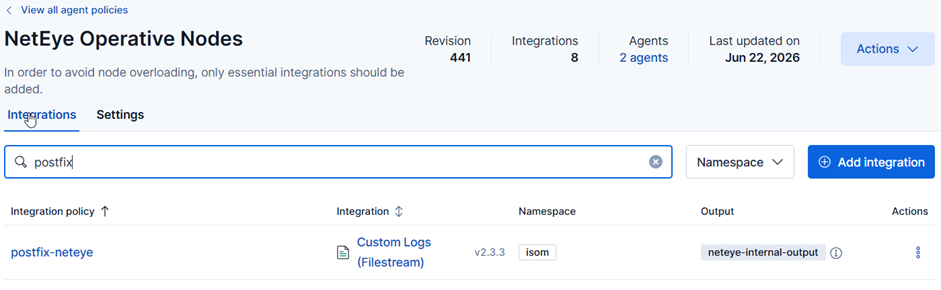
Of course, the goal was not simply to send the logs in bulk, but to have them appear in a structured way. This makes them much easier to search, and you can even create alerts for them.
And here comes the difference compared to reading the logs from files. If we import the data into Elastic, it’s very easy to build alerts on them and forward them to NetEye. This way we can be immediately informed if any anomaly appears, for example, too many ABRT messages or too many deferred log entries are generated. In other words, we can notice the problem before the logs start disappearing due to the rate limit.
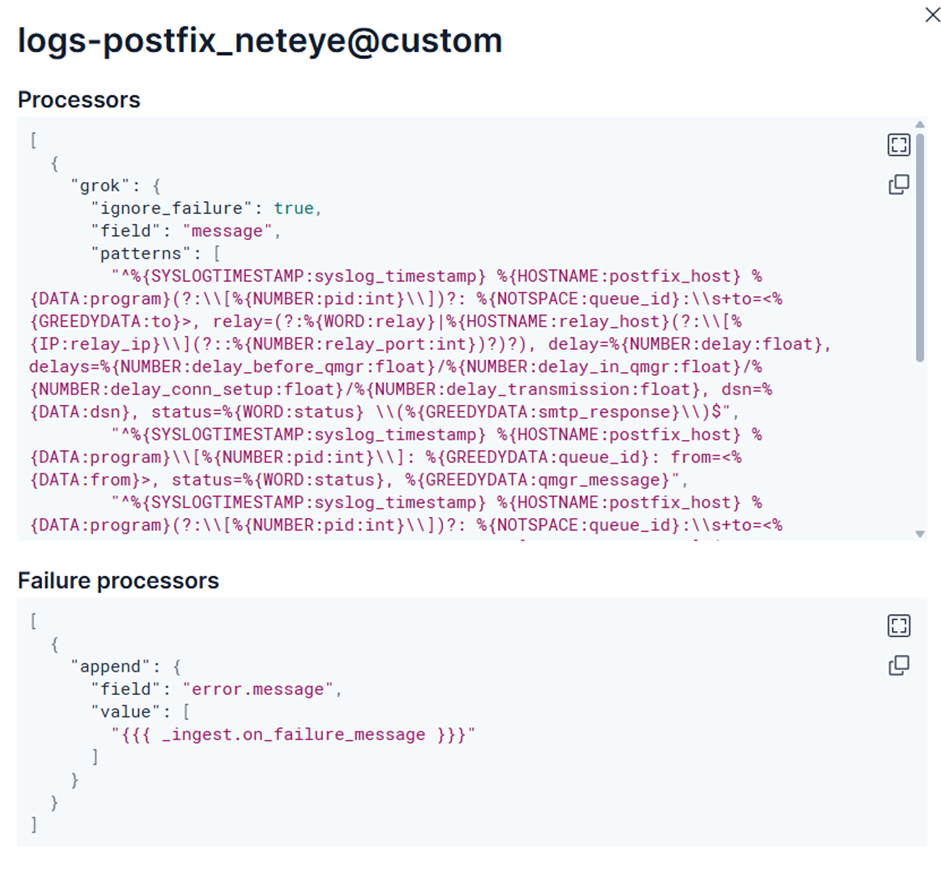
This solution is based on an index template and a grok-based processing pipeline. We extract several structured fields from the raw Postfix log entries, such as:
- timestamp
- host
- program and PID
- queue ID
- sender (from)
- recipient (to)
- relay host and relay IP
- delay values (delay and detailed delay components)
- DSN
- status, such as sent or deferred
- SMTP response
- size and number of recipients
This step is important because from now on we are no longer thinking in simple lines of text, but in events that can be easily filtered and linked. If someone is curious about the fate of a given email or wants to see anomalies over a period of time, they no longer have to start their work by manually browsing the logs.
What Does Elastic Do in Practice?
The configuration is now in place, and the logs are continuously flowing into Elastic. Let’s take a look at the three tools that provide a real advantage over manually browsing log files in the terminal.
Discover: When you need to find an answer quickly
The Discover view provides the first and most obvious advantage: access to events from the mail log in a central, searchable interface. This means that the user or operator can quickly filter by host, queue ID, sender, recipient or status, for example.
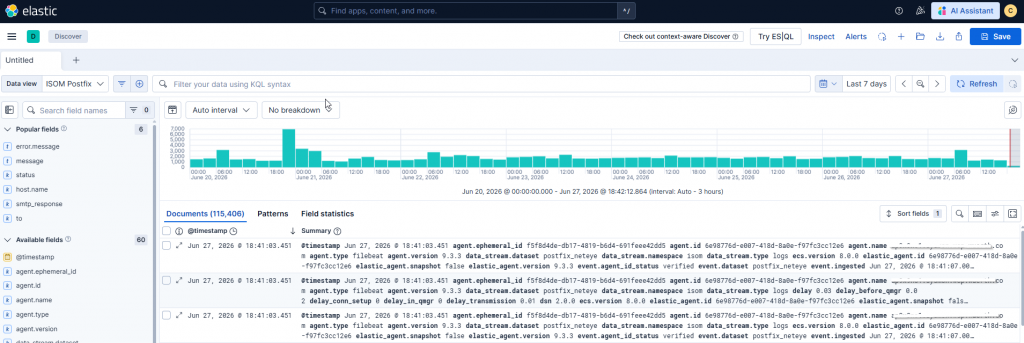
This is especially useful in cases where you need to look back at what happened to a message following a specific notification. In the case of a question about the delivery of a monthly report or an email related to ticketing, you can get to the relevant entries much faster.
Discover is therefore not just a convenience feature, but a tool that directly improves the speed and quality of the investigation. From the team’s perspective, this also means less time spent gathering data and more time spent identifying the real causes. The point is not to look at more logs, but to find relevant entries faster.
Dashboard: When you’re looking for patterns, not single events
Discover is primarily useful for detailed analysis, while Dashboards are for the big picture. Here, we’re no longer focusing on a single event, but on patterns and trends. The dashboard we’ve created helps you look at Postfix from multiple perspectives.
The displayed elements include the following:
- Number of sent events
- Number of deferred events
- Percentage distribution of statuses
- Time trend for sent and deferred states
- Top senders
- External relay destinations
- Event table for quick inspection of raw logs
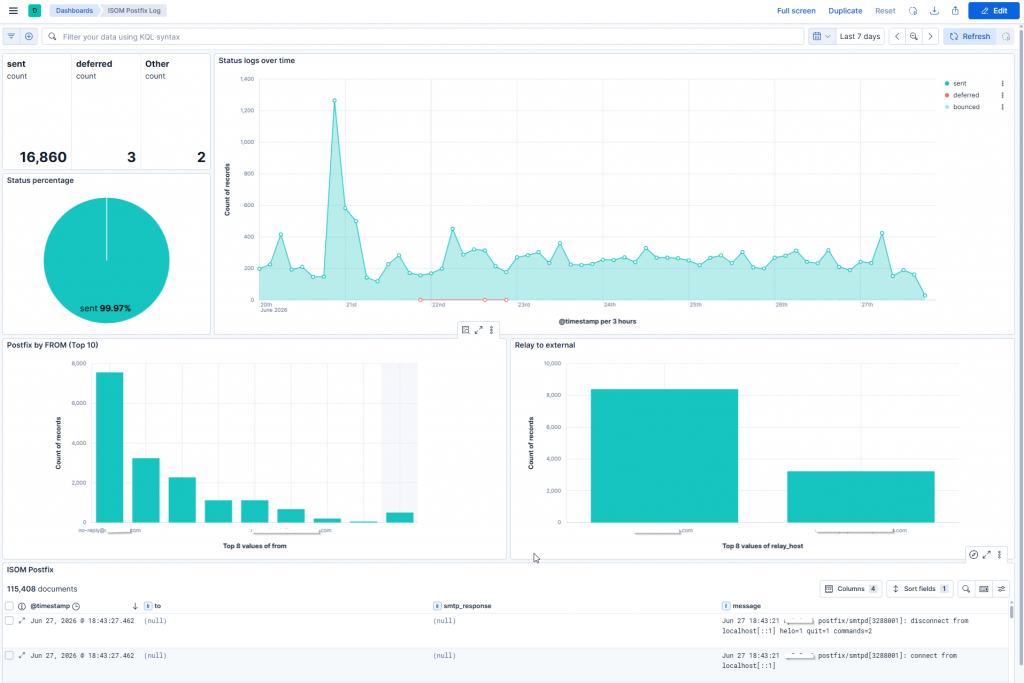
The advantage of this is that we can not only examine individual errors, but also quickly notice when some anomaly is starting to develop, such as the previously mentioned excessive ABRT messages or a spike in deferred events. These can be useful early indicators in themselves, even before the problem fully develops.
Alert: So that we don’t only notice the problem afterwards
Now we can easily search the logs and monitor the dashboards, but these are essentially reactive tools. We also wanted to be able to see immediately if an anomaly occurs, without having to go into Kibana separately.
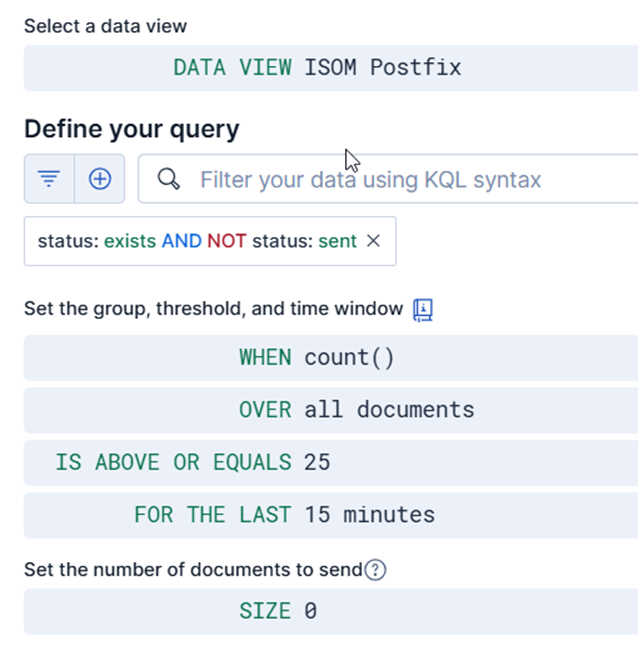
This is where Elastic’s alerting capabilities come into play. We also supported the previous two approaches with a simple but specific alerting logic. If an aggregate of 25 deferred events occurs within 5 minutes, the rule is triggered and an alert is immediately generated in NetEye via the configured channel.
We look at this threshold in an aggregated manner because the original problem was not limited to the local operation of a single host, but was related to the noise load of the entire system and its consequences. This shows what the two platforms can do together: Elastic helps to recognize and visualize the pattern, and NetEye ensures that this becomes a real signal and an actionable event at the operational level.
What Was the Result?
The most important result is that the analysis of Postfix operation has become more structured and reliable. Instead of relying solely on local files and manual log browsing, we now have a central, searchable and visually clear picture of events.
It’s important to emphasize that the goal was not to solve every problem simply by collecting logs. Rather, it was to create visibility around a critical but long-running service that really helps operations.
Summary
Postfix in the NetEye environment is much more than a simple mail relay. It’s a central service that handles notifications, ticketing-related emails, reports and system messages. Therefore, when local logging no longer proved to be a reliable basis for troubleshooting, a new approach was justified.
Logging into Elastic, structured parsing, and dashboard-based overviews combined to create an operating model that will support both detailed investigation and quick operational insight. Discover helps you find unique events, the dashboard helps you spot trends, and NetEye can alert you at the right point.
Not only do we have more data, but we also have better insight. And often, that’s the difference between just guessing what happened to an email and actually being able to know.
The Elasticsearch configuration was prepared by Alexander Kensy from Team ISOM, Würth IT Germany.
These Solutions are Engineered by Humans
Are you passionate about performance metrics or other modern IT challenges? Do you have the experience to drive solutions like the one above? Our customers often present us with problems that need customized solutions. In fact, we’re currently hiring for roles just like this as well as other roles here at Würth IT Italy.
Csaba Remenar
Technical Consultant at Würth IT Italy
Author
Latest posts by Csaba Remenar
23. 09. 2025
NetEye
Minimizing Downtime: NetEye MariaDB Database Rebuild with Containers and Logical Backup
30. 06. 2025
NetEye, Unified Monitoring
Alertmanager Alert Filtering Rules – Effective Alert Management in Practice
31. 03. 2025
NetEye, Service Management
Improving Your Backup of MariaDB