30. 06. 2026
Azure, Cloud, Microsoft, NetEye, NetEye Extension Packs, Unified Monitoring

Microsoft Exchange server is one of the most used email server for companies but sometimes it is hard to monitor because usually the monitoring tools only control the availability of the server on the network.
Thanks to the 2013 update, Microsoft offered several URL (Healthcheck URL) to verify the real server availability for clients.
The URL address have the following structure:
https://<External FQDN>/<protocol>/healthcheck.htm
Whereas the <protocol> can be substitute by:
- OWA Outlook Web App
- ECP Exchange Control Panel
- OAB Offline Address Book
- AutoDiscover Autodiscover process
- EWS Exchange Web Services (Mailtips, Free/Busy, Lync clients, Outlook for Mac)
- Microsoft-Server-ActiveSync Exchange ActiveSync
- RPC Outlook Anywhere
- MAPI MAPI/HTTPS (da Exchange 2013 SP1)
A recurring control gives the possibility to anyone to monitor the server operations, but it doesn’t help to verify the presence of low performances and adjustments.
For a better control, it is necessary to use an agent set up on the server Exchange that can read periodically the performance data displayed by Exchange (Performance Counters), in order not to overload the server and worsen the service.
NetEye solution
We offer a NetEye monitoring solution for Exchange, which uses 3 different open source components:
- Telegraf to collect performance data on server Exchange
- InfluxDB to memorize those data and create historical series
- Grafana to create a Dashboard that shows the significat results
Telegraf is a lightweight agent that you can install on your Exchange server. You can set the regularity of data collection (we suggest 5 seconds) and Telegraf send the by network to a remote InfluxDB database. The agent keeps also a local buffer, so that you don’t lose data in case of temporary networking problems
InfluxDB is a database that creates historical series and allows a quick access to data during analysis.
Grafana creates interactive Dashboards that show the significant monitoring data on several dashborads, associated to different time.
Both InfluxDB and Grafana are standard components for NetEye v 3.9
What to monitor for performance control
You need to keep under control several features to perform a good monitoring:
First check Email queue as spam emails flow, unusual user frequency activity (i.e. Christmas wish) or internet connectivity can condition the performance.
Then you can check the latency on the access to Active Directory, since unsolved problems may create serious damages to Exchange server.
We also suggest to check user data for ActiveSync (smartphones connections to Exchange server), Outlook Web Access (access through web) and RPC (Outlook).
As far as OWA, Exchange 2016 has some problems in generating those data because usually they aren’t available and reliable. You can use .NET and ASP as an alternative analysis tools.
For what concerns database, we suggest to monitor the generation frequency of log files on DISK so that you can find easily anomalies and the number of sessions. Please remind that Exchange uses a lot of Cache, so a low Hit Count can show a lack on server’s memory and can cause slow down.
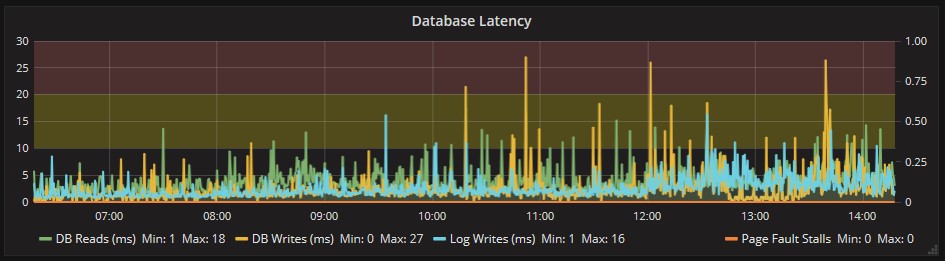
Last but not least, the disk access where the Databases are stored: in case of excessive latency, there will be an overall performance issue.
Grafana shows these results on one unique Dashboard where you can immediately see the anomalies happened during the selected period of time. The dashboards are synchronized to show an accurate overview of critical moments.
For example, here below you can see a general overview:
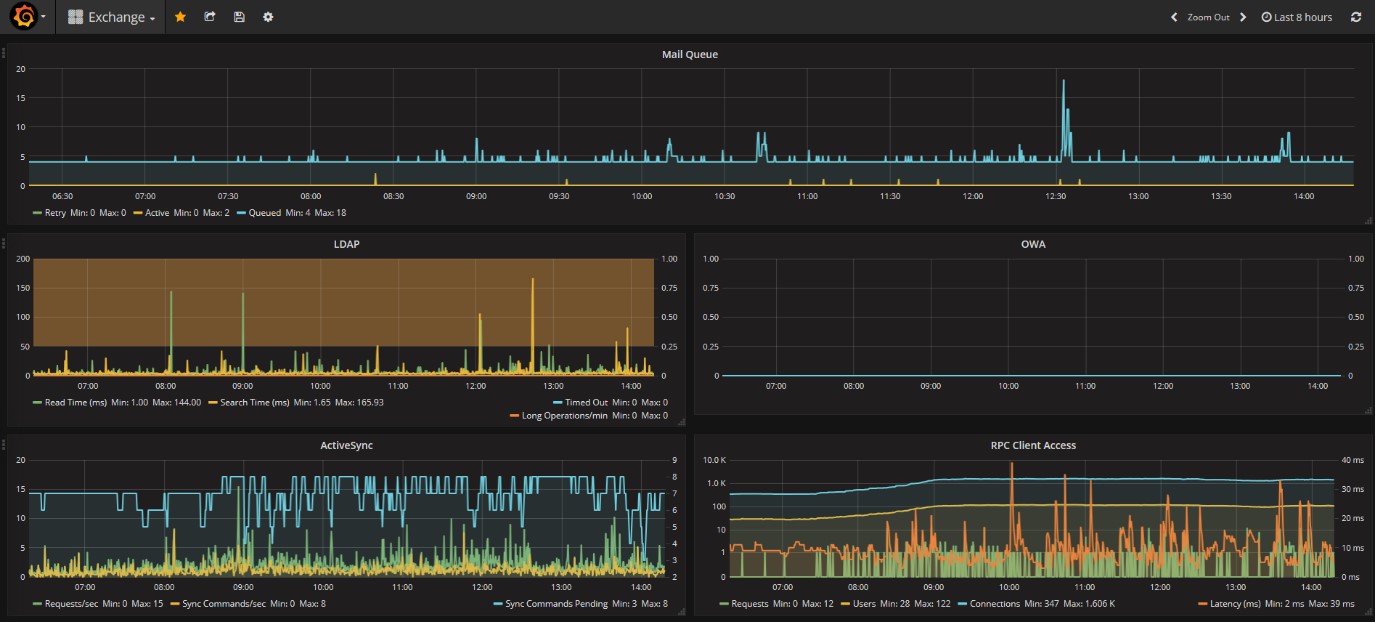
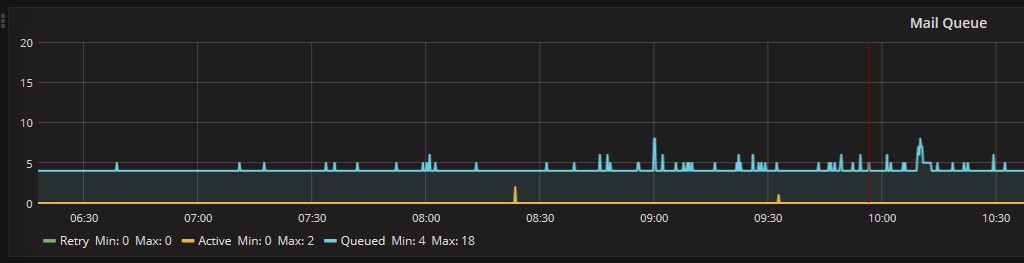
Now we can take a closer look on emails queue which, in the example below, presents an ordinary trend:
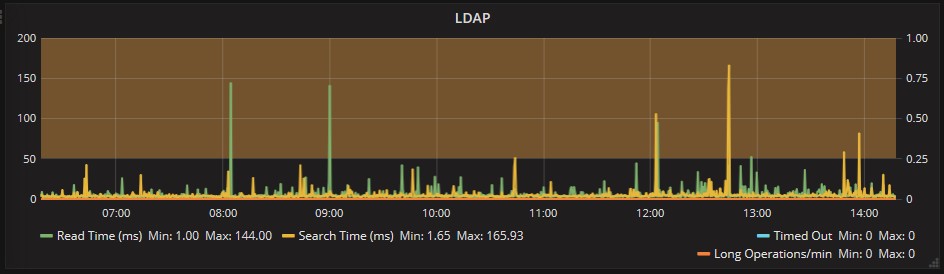
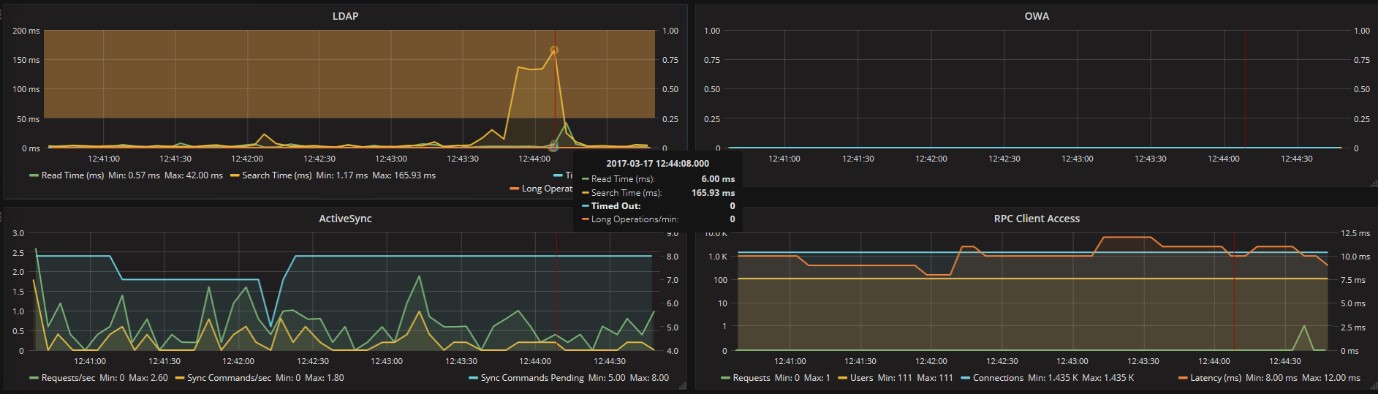
Or we can take a look LDAP for Active Directory. Here below you can see that sometimes the responses were slower, but still not incisive on the overall performance:
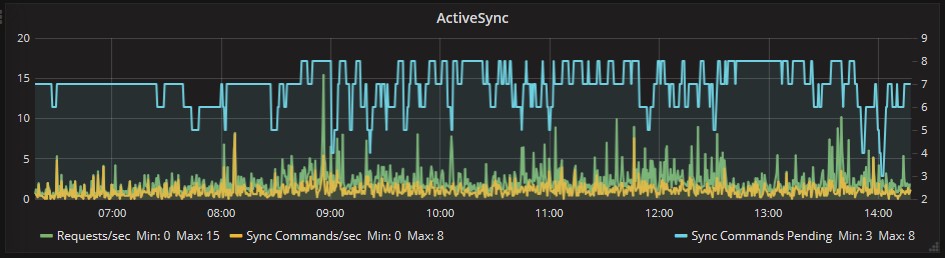
ActiveSync dashboard shows a correct work during the analyzed period:
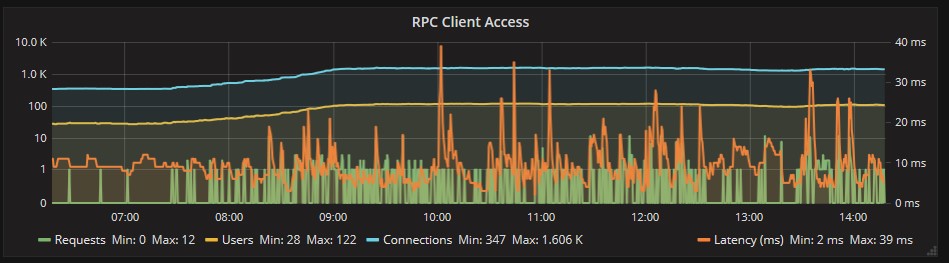
RPS (Outlook) server too has a correct response for connections:
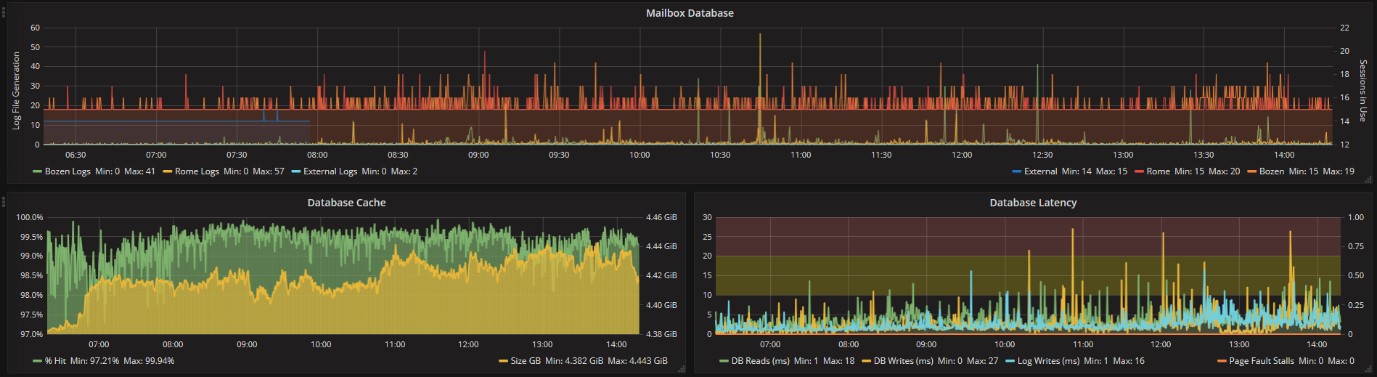
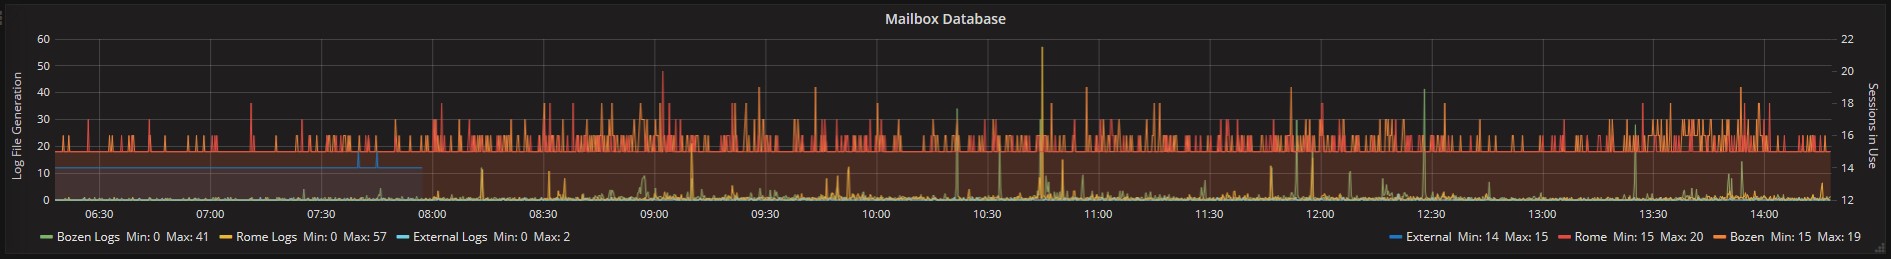
In the example below, the 3 email database have a normal log generation frequency:
Cache in Exchange memory is properly used, this means that there is no problem for RAM shortage:
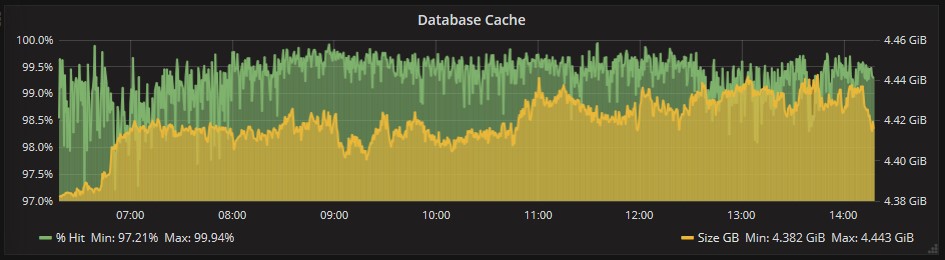
The database Latency show instead some slowdown, but only for a couple of time. At the there are no stalls, but the values must be monitored.
If you want to have a detailed overview on a certain LDAP value, you can narrow the analyzed period of time. In this way, you can better see what might have cause the value and what might have been its consequences over other features.
Conclusion
The features shown in this post are only an example of how you can monitor an Exchange server.
You can of course personalize the Dashboard to see what you need to monitor according to your company architecture, and so for example you can also include a dashboard for Antispam or Mail relay.

Alessandro Romboli
Site Reliability Engineer at Würth IT Italy
My name is Alessandro and I joined Würth Phoenix (now Würth IT Italy) early in 2013. I have over 20 years of experience in the IT sector: For a long time I've worked for a big Italian bank in a very complex environment, managing the software provisioning for all the branch offices. Then I've worked as a system administrator for an international IT provider supporting several big companies in their infrastructures, providing high availability solutions and disaster recovery implementations. I've joined the VMware virtual infrastructure in early stage, since version 2: it was one of the first productive Server Farms in Italy. I always like to study and compare different technologies: I work with Linux, MAC OSX, Windows and VMWare. Since I joined Würth Phoenix, I could also expand my experience on Firewalls, Storage Area Networks, Local Area Networks, designing and implementing complete solutions for our customers. Primarily, I'm a system administrator and solution designer, certified as VMware VCP6 DCV, Microsoft MCP for Windows Server, Hyper-V and System Center Virtual Machine Manager, SQL Server, SharePoint. Besides computers, I also like photography, sport and trekking in the mountains.
Author
Latest posts by Alessandro Romboli
17. 06. 2026
Microsoft
UEFI Secure Boot Nightmare
03. 12. 2025
Microsoft
Single Sign-On for Power BI Report Server
08. 09. 2025
Service Management
VMware ESXi Transparent Page Sharing
12. 06. 2025
Microsoft
Terminal Server User Profiles with FSLogix