30. 06. 2026
Azure, Cloud, Microsoft, NetEye, NetEye Extension Packs, Unified Monitoring


Scheduling downtime is extremely useful, if not essential, for the correct management of a monitoring system.
What exactly is downtime and what is the reason for having it?
“Downtime can be scheduled for planned server maintenance or any other targeted service outage you are aware of in advance.
Downtime suppresses notifications and can trigger other periods of downtime too. If the downtime was set by accident, or the duration exceeds the maintenance window(s), you can manually cancel the downtime.” [1]
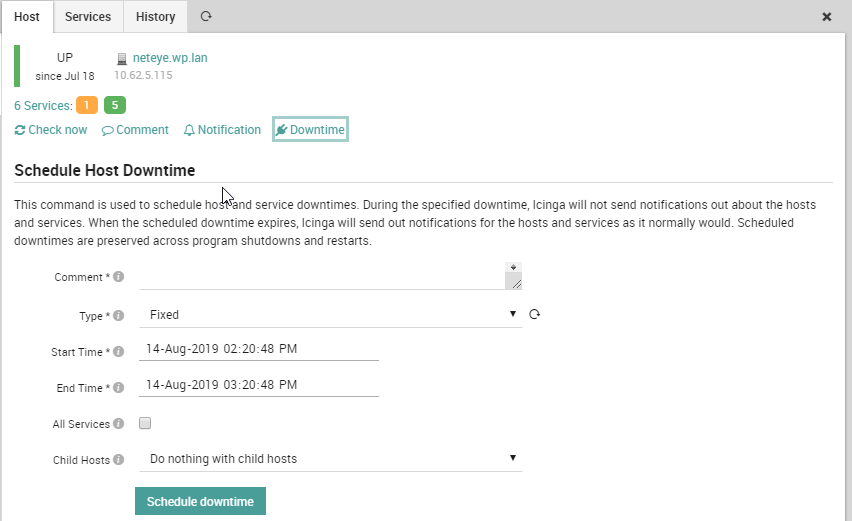
Downtime can be scheduled manually from the NetEye4 web interface both for one or more hosts, and for one or more services, by indicating the start and end dates.
There is also the possibility to schedule downtime using the Icinga 2 API, and many customers have had the opportunity to integrate downtime into particular procedures such as backup scripts, cronjobs, or maintenance planning by users who do not have direct access to the NetEye 4 web interface.
A very interesting example has been implemented in Cembre SpA to make use of downtime that is completely automated within a script used by different teams for the shutdown and reboot of a Windows server.
This script must be run on a Windows host monitored by NetEye 4, and allows an administrator user to perform the following actions:
 1 - Reboot and add Host Downtime
 2 - Shutdown and add Host Downtime
 3 - Abort Shutdown and remove Host Downtime
 4 - Add host downtime
 5 - Remove host downtime
 6 - Add single service downtime
 7 - exit
The script was implemented in Powershell by Paolo Pintossi of Cembre SpA and is available for download at the link at the bottom of this article. [2] Many thanks to Paolo for his collaboration and his willingness to freely share the code.
Requirements
To use the script you need to create a new Icinga 2 API user in the following file: /neteye/shared/icinga2/conf/icinga2/conf.d/api-users.conf [3]
Example:
[root@neteye conf.d]# cat api-users.conf
/**
 * The ApiUser objects are used for authentication against the API.
 */
object ApiUser "autodowntime" {
        password = "35vsdf5uf00cd41b6722sd6f"
        permissions = [
            "objects/query/Host",
            "objects/query/Service",
            "objects/query/Downtime",
            "actions/acknowledge-problem",
            "events/*",
            "status/query",
        ]
}
Finally you will need to adapt the initial part of the script, indicating:
- The Windows domain to complete the variable $serverHostName
- API User and password
- The NetEye 4 Host Name (FQDN)
For example:
 function serverUtilitiesModule {
   [CmdletBinding()]
   param(
     [string]$serverHostName = $env:computername.tolower()+".mydomain.com",
     [string]$apiUsername        = 'autodowntime',
     [string]$apiPassword        = '35vsdf5uf00cd41b6722sd6f',
     [string]$Neteye4HostName    = 'neteye4.mydomain.com',
     [string]$Neteye4Port        = '5665',
     [int]$defaultDownTime       = 30,
     [int]$firstRun              = 0,
 ……
 …
[1] To read more about downtime click here.
[2] Download the script here.
[3] To read more about Icinga2 API authentication click here.

Giuseppe Di Garbo
Consultant at Würth IT Italy
Hi everybody. I’m Giuseppe and I was born in Milan in 1979. Since the early years of university, I was attracted by the Open Source world and operating system GNU\Linux. After graduation I had the opportunity to participate in a project of a startup for the realization of an Internet Service Provider. Before joining Würth Phoenix (now Würth IT Italy) as SI consultant, I gained great experience as an IT consultant on projects related to business continuity and implementation of open source software compliant to ITIL processes of incident, change and service catalog management. My free time is completely dedicated to my wife and, as soon as possible, run away from Milan and his caotic time and trekking discover our beautiful mountain near Lecco for relax and lookup the (clean) sky.
Author
Latest posts by Giuseppe Di Garbo
23. 06. 2026
Atlassian
Customer Feedback in Jira Service Management: CSAT and Native Surveys Explained
19. 12. 2025
Atlassian, Service Management
Jira Service Management Customer Detail Fields: A Practical Use Case
29. 09. 2025
Atlassian, Service Management
Streamlining Service Request Management with ITIL4 and Jira Service Management
30. 06. 2025
Atlassian, Service Management
Creating Jira Service Management Requests from a Public Website? Here’s the Secure, No-API Way