In a previous blog I explored beats such as Icingabeat and presented
an overview of the new features present in NetEye since version 4.6.
I’d like to explore the following use case: collect some logs from Elasticsearch, Logstash, the operating system that hosts NetEye, and MySQL using beats (Filebeat), all in order to show the potential of Log UI.
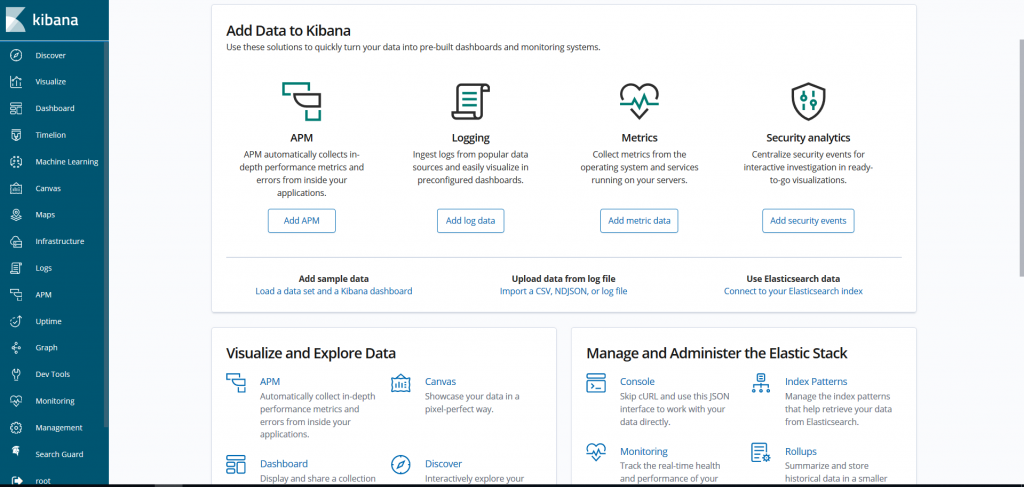
I open Log Analytics and voilà:
Then I click on Add Log Data:
I have the various modules present and for each module there
is a simple guide that accompanies me during the installation of the various
components, with a link describing how to configure the various logs.
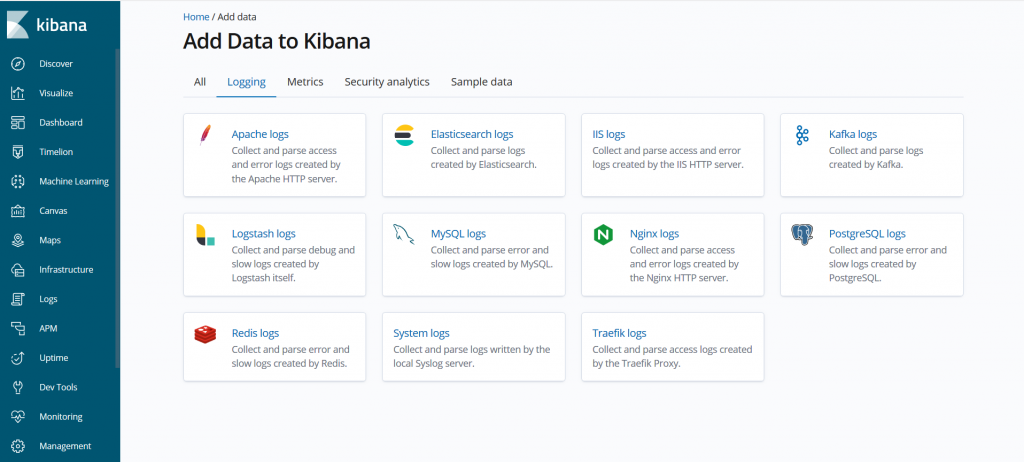
I start with the Elasticsearch log by clicking on the link.
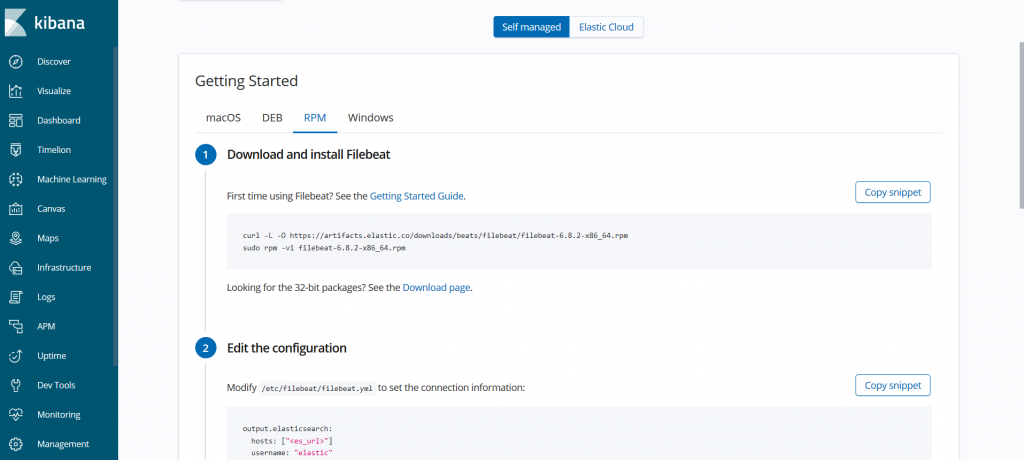
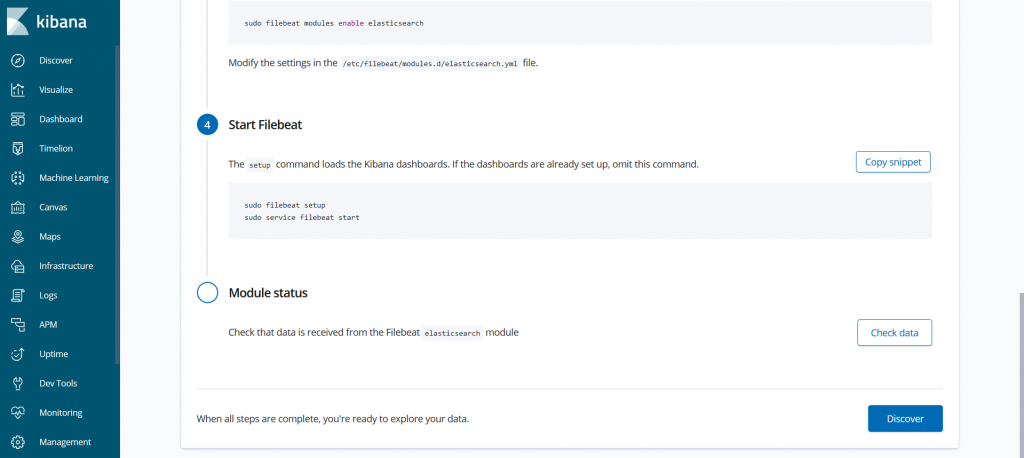
Then I follow the various steps shown in the image.
In the file elasticsearch.yml
I set the various paths of the Elasticsearch log, which in my case are in the folder
/neteye/local/elasticsearch/log/.
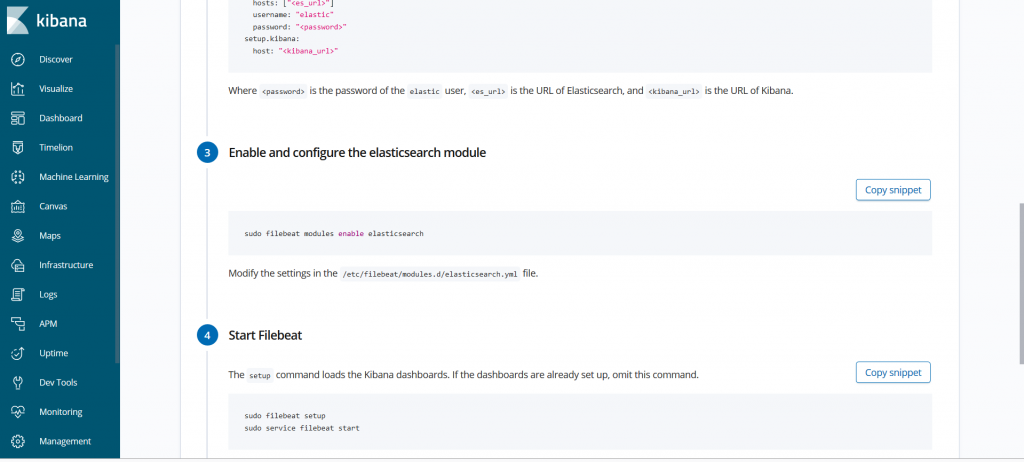
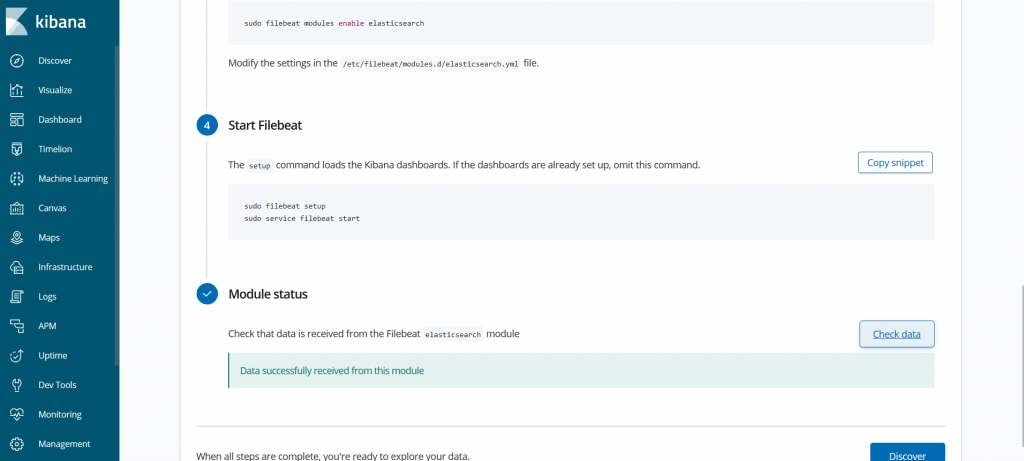
At the end, after starting the Filebeat process, I can now verify my configuration with Module status.
The button Check data
lets me verify whether data is arriving to my system and, in my case everything
is okay.
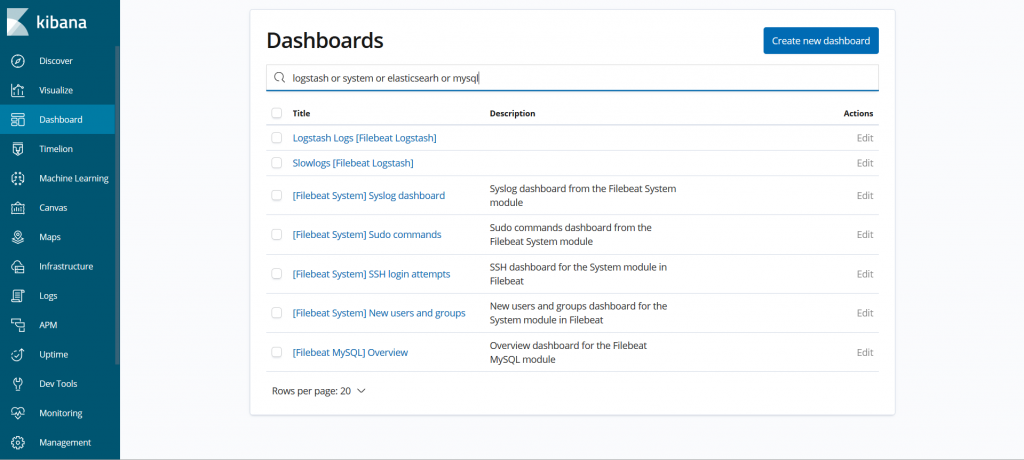
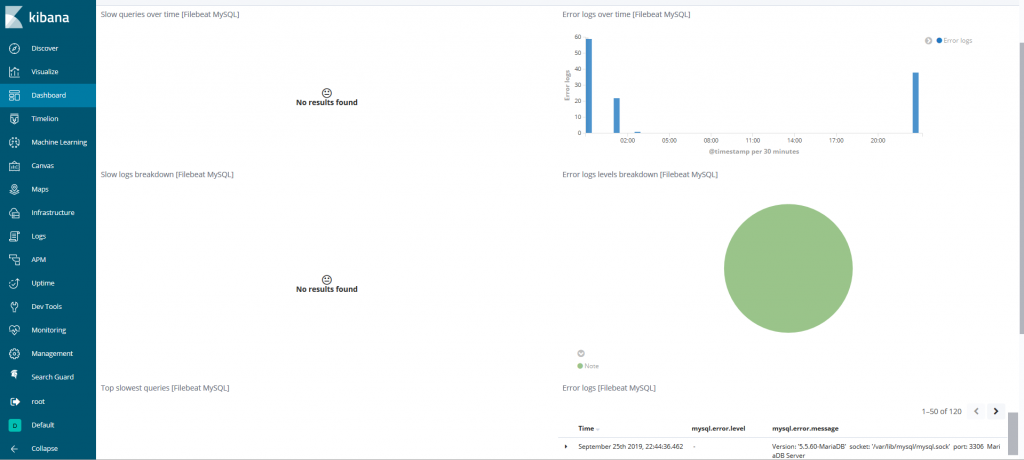
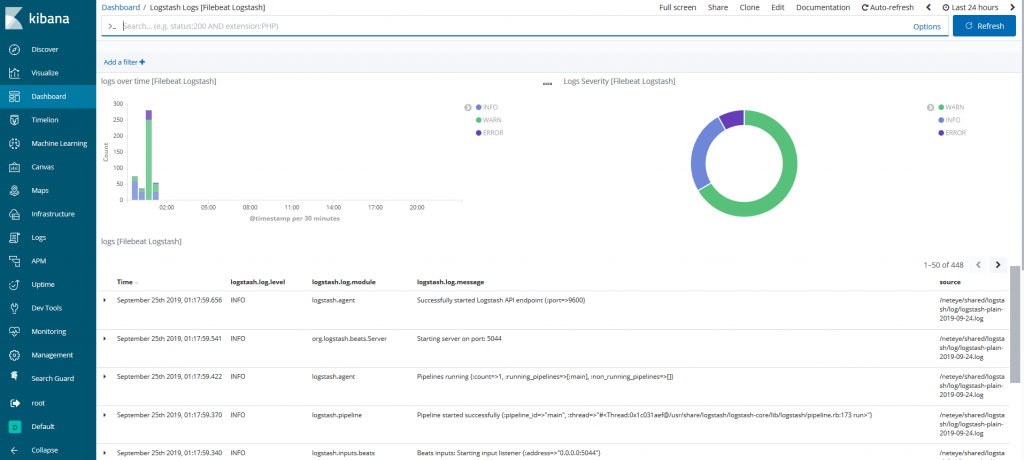
I’m using the same procedure to configure the other logs (logstash, system and mysql). Then I can explore that dashboard that I have in my system. So I click on Dashboard and select my logs.
Here I’m only showing 3 dashboards. The others I’ll invite
you to explore on your own.
I’ll show you just:
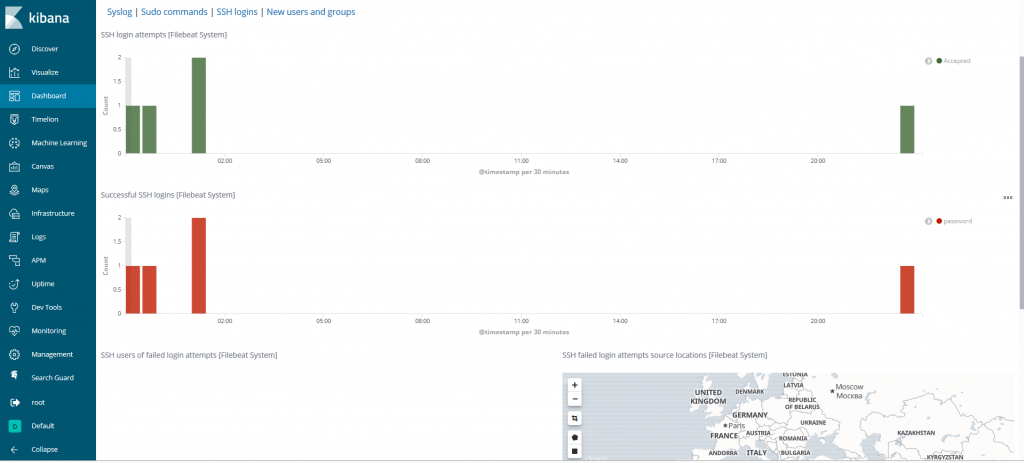
1) SSH login attempts
2) MySQL overview
3) Logstash logs
And now you might ask me, “Where do I find the Elasticsearch log? And how can I correlate this log?”
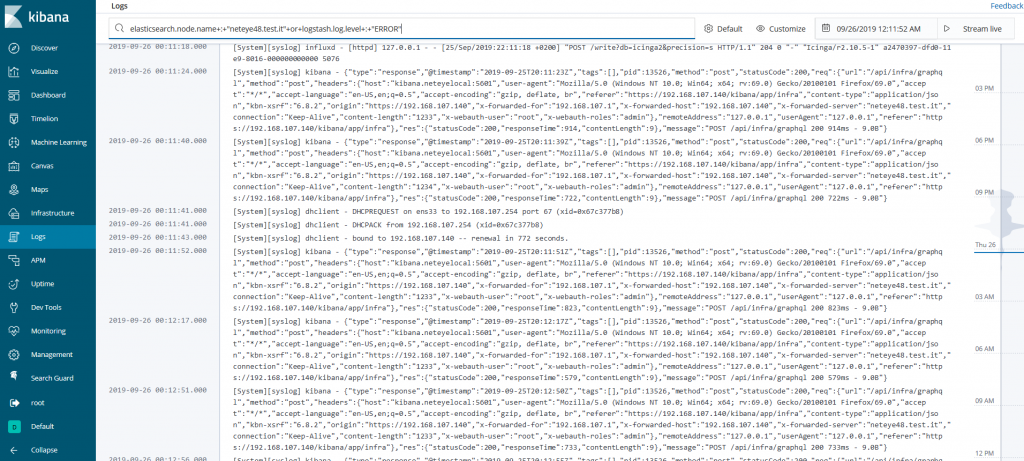
The response is to click on Logs.
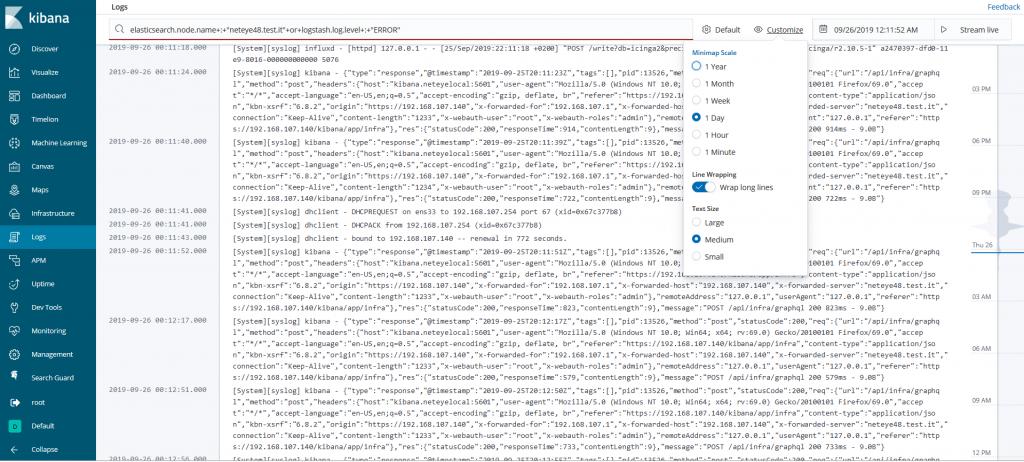
Using Logs is similar to tailing a log file in a shell, but with all of your logs from all of your systems available in a single console. The logs stream in, and the bottom of the view is the most recent record, just like a tail -f. By default, the Logs shows you all of the records from all of the logs that meet the configuration criteria.
When I’m working on an issue and decide that I don’t want all logs, from all services, all together (streaming by faster than anyone could possibly read), then I just change the interaction by typing in the search bar at the top. For example, if I only want to see errors on Logstash and the log message on Elasticsearch in order to correlate, I just start typing in the search bar and let the autocomplete help me find the right logs.
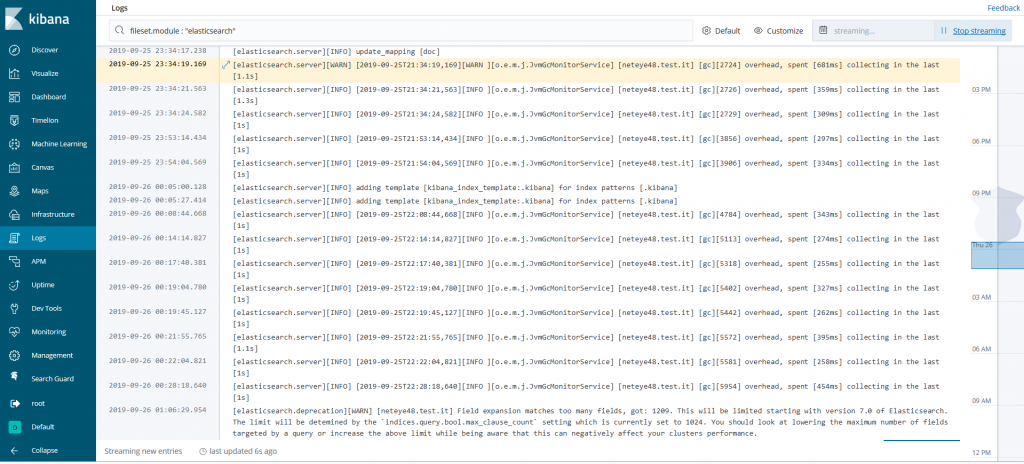
Another beautiful feature for me is that there is the possibility to view all logs, or a single log live by clicking on the button Stream live. Here I show how to view my Elasticsearch log in live mode.
It’s also possible to customize this view by clicking on the Custom button.
Franco Federico
Hi, I’m Franco and I was born in Monza. For 20 years I worked for IBM in various roles. I started as a customer service representative (help desk operator), then I was promoted to Windows expert. In 2004 I changed again and was promoted to consultant, business analyst, then Java developer, and finally technical support and system integrator for Enterprise Content Management (FileNet). Several years ago I became fascinated by the Open Source world, the GNU\Linux operating system, and security in general. So for 4 years during my free time I studied security systems and computer networks in order to extend my knowledge. I came across several open source technologies including the Elastic stack (formerly ELK), and started to explore them and other similar ones like Grafana, Greylog, Snort, Grok, etc. I like to script in Python, too. Then I started to work in Würth Phoenix like consultant. Two years ago I moved with my family in Berlin to work for a startup in fintech(Nuri), but the startup went bankrupt due to insolvency. No problem, Berlin offered many other opportunities and I started working for Helios IT Service as an infrastructure monitoring expert with Icinga and Elastic, but after another year I preferred to return to Italy for various reasons that we can go into in person 🙂 In my free time I continue to dedicate myself to my family(especially my daughter) and I like walking, reading, dancing and making pizza for friends and relatives.
Author
Franco Federico
Hi, I’m Franco and I was born in Monza. For 20 years I worked for IBM in various roles. I started as a customer service representative (help desk operator), then I was promoted to Windows expert. In 2004 I changed again and was promoted to consultant, business analyst, then Java developer, and finally technical support and system integrator for Enterprise Content Management (FileNet). Several years ago I became fascinated by the Open Source world, the GNU\Linux operating system, and security in general. So for 4 years during my free time I studied security systems and computer networks in order to extend my knowledge. I came across several open source technologies including the Elastic stack (formerly ELK), and started to explore them and other similar ones like Grafana, Greylog, Snort, Grok, etc. I like to script in Python, too. Then I started to work in Würth Phoenix like consultant. Two years ago I moved with my family in Berlin to work for a startup in fintech(Nuri), but the startup went bankrupt due to insolvency. No problem, Berlin offered many other opportunities and I started working for Helios IT Service as an infrastructure monitoring expert with Icinga and Elastic, but after another year I preferred to return to Italy for various reasons that we can go into in person :) In my free time I continue to dedicate myself to my family(especially my daughter) and I like walking, reading, dancing and making pizza for friends and relatives.