
22. 10. 2020
Alessandro Valentini
NetEye, Unified Monitoring
Kentix MultiSensor-LAN: Integration with NetEye4
Kentix MultiSensor is a device which includes many sensors for use in monitoring server and IT rooms. The sensor only needs to be connected to your network (PoE is required) and to have SNMP configured through its web interface.
The LAN version we used in this test monitors:
- Temperature
- Humidity
- Dewpoint
- Fire (carbon monoxide)
- Motion
- Vibration
More info about threats detected by Kentix Multisensor-LAN can be found in the threat matrix.
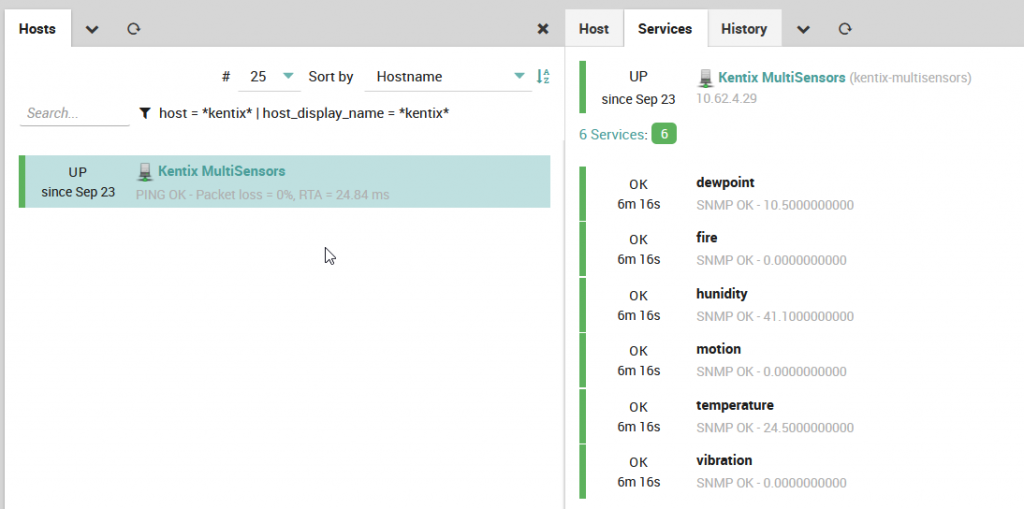
This sensor can feed data to NetEye 4 using both SNMP requests, which can be directly polled by Icinga 2, and SNMP traps, which can be collected using the Tornado SNMP Collector. Both SNMP v2 and v3 are supported.
Temperature, humidity, dewpoint and fire can be monitored using the check_snmp script and creating a service set to monitor them.
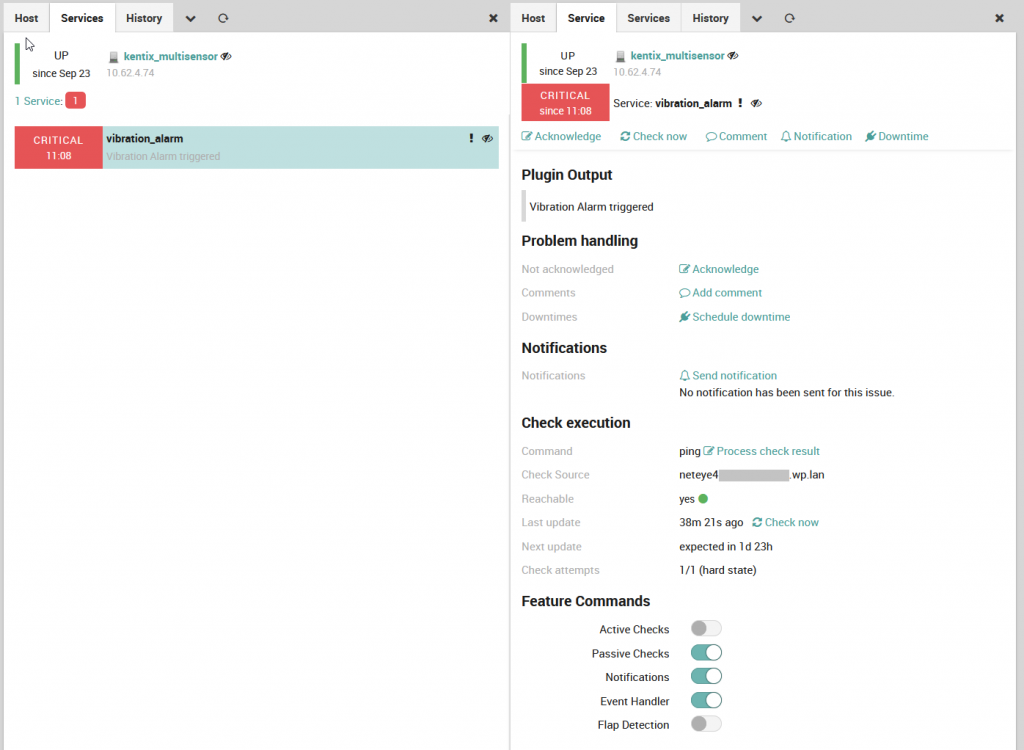
Motion and vibration instead cannot be periodically polled: these alarms are event-based and therefore checking them once every 5 minutes can easily cause you to miss an intrusion or vibration event. We can overcome this problem by using Tornado’s SNMP collector to filter relevant traps and move a service to critical status in the case of vibration or intrusion events.
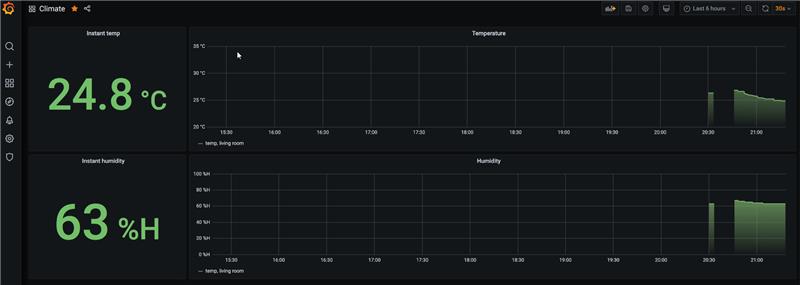
Collected values, such as temperature and humidity, can be shown in in an ITOA dashboard:
The capabilities of Kentix’s Multisensor can be extended with their Leakage sensor and Door sensor.


Alessandro Valentini
DevOps Engineer at Würth IT Italy
Platform Engineer at Würth IT Italy
Author
Latest posts by Alessandro Valentini
05. 08. 2025
DevOps, Kubernetes
Use S3 Storage with OpenShift Data Foundation
04. 03. 2025
Automation, DevOps, Service Management
Group-aware Reboot with Ansible
31. 12. 2024
DevOps
GitOps: Pull-based vs Push-based Approaches