30. 06. 2026
Azure, Cloud, Microsoft, NetEye, NetEye Extension Packs, Unified Monitoring

23. 12. 2024
Damiano Chini
APM, Development, Log-SIEM, NetEye
Continuous Profiling with NetEye – Elastic Universal Profiling
Elastic 8.16, which comes with NetEye 4.39, made Elastic Universal Profiling generally available for self-hosted installations. This means that NetEye SIEM installations will now be able to take advantage of the continuous profiling solution by Elastic.
In this blog post we’ll explain what you can achieve with continuous profiling, and how you can configure it in NetEye.
Why continuous profiling?
Continuous profiling is a process that aims at reducing the operational costs and latency of your applications. In particular, continuous profiling allows you to find bottlenecks in your applications in production environments, which you can then optimize to reduce CPU costs and reduce application latency.
Continuous profiling also significantly improves incident management by offering valuable insights into your applications. This enables you to quickly identify the root causes of performance issues, ultimately reducing the Mean Time to Resolution.
The tool that Elastic provides to add continuous profiling to its Observability solution is Elastic Universal Profiling.
If you’re interested in the reasons for profiling complements logs, metrics and traces (aka the three pillars of Observability), you can take a look at this interesting blog post.
Elastic Universal Profiling configuration in NetEye
The configuration of Elastic Universal Profiling can be divided into 2 steps. First we’ll configure the Profiling Collector backend which will collect the profiles sent from the external profiled machines, and then we’ll configure the profiled machines to send the profiles to our Profiling Collector backend.
This guide is an adaptation to NetEye of the official Elastic guide, so you can check that out for further details.
Note that to see the function names and line numbers in traces of applications written in programming languages that compile to native code (C, C++, Rust, Go, etc.), you’ll need also to configure the Symbolizer Backend, which we’ll cover in a future blog post.
Prerequisites
- NetEye SIEM with version 4.39 or greater
- Elastic Enterprise license
- Profiled machines must be Linux machines with kernel version >= 4.19 for x86_64 or 5.5 for ARM64 machines
Configuring the Profiling Collector Backend
Enable Universal Profiling feature in Kibana
Assuming that you’ve already activated the Elastic Enterprise license, the first step is to activate the Universal Profiling feature in Kibana by adding the following line to your kibana.yml file, and then restarting the Kibana service:
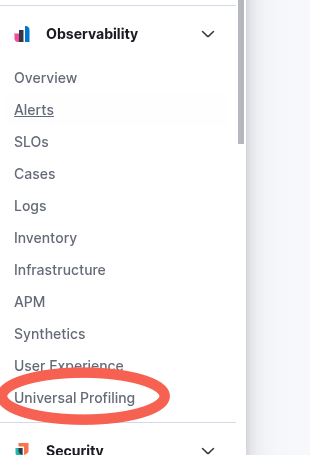
xpack.profiling.enabled: trueAfter this step you’ll see a new entry in the Kibana menu under Observability:
Run the Profiling Collector Backend
You have various options to run the Profiling Collector Backend. In this guide we’ll go for the simplest option by running the dedicated container with podman.
Create an API Key for the Profiling Collector as explained here, and keep the base64 encoded API Key, since it’s needed in the next step to configure the Profiling Collector.
Create a new configuration file /etc/Elastic/universal-profiling/pf-elastic-collector.yml. Substitute <my-secret-token> with any secret string of your choice, <my_neteye_fqdn> with your NetEye FQDN, and <my_base_64_encoded_api_key> with the base64 encoded API Key created in the previous step:
pf-elastic-collector:
  # Defines the host and port the server is listening on.
  host: "0.0.0.0:8260"

  # Agent authorization configuration. If no methods are defined, all requests will be allowed.
  auth:
    # Define a shared secret token for authorizing agents.
    secret_token: "<my-secret-token>"

  # Enable secure communication between pf-host-agent and pf-elastic-collector.
  ssl:
    enabled: false


#================================ Outputs =================================

# Configure the output to use when sending the data collected by pf-elastic-collector.

#-------------------------- Elasticsearch output --------------------------
output.elasticsearch:
  # Array of hosts to connect to.
  # Scheme and port can be left out and will be set to the default (`http` and `9200`).
  # In case you specify and additional path, the scheme is required: `http://localhost:9200/path`.
  # IPv6 addresses should always be defined as: `https://[2001:db8::1]:9200`.
  hosts: ["<my_neteye_fqdn>:9200"]


  # Protocol - either `http` (default) or `https`.
  protocol: "https"

  # Authentication credentials - either API key or username/password.
api_key: "<my_base_64_encoded_api_key>"Note: in production environments remember to enable secure communication with the agents by setting
ssl.enabledtotrueand generating the necessary certificates.
Then run the podman container with:
dnf install podman
podman run -d --name pf-elastic-collector -p 8260:8260 -v /etc/Elastic/universal-profiling/pf-elastic-collector.yml:/pf-elastic-collector.yml:ro docker.elastic.co/observability/profiling-collector:8.16.2 -c /pf-elastic-collector.yml
We also need to open port 8260:
firewall-cmd --add-port=8260/tcpYour NetEye instance is now able to collect profiles from the profiling agents, so let’s proceed to configure the agent on a target machine!
Configuring the Profiling Agent
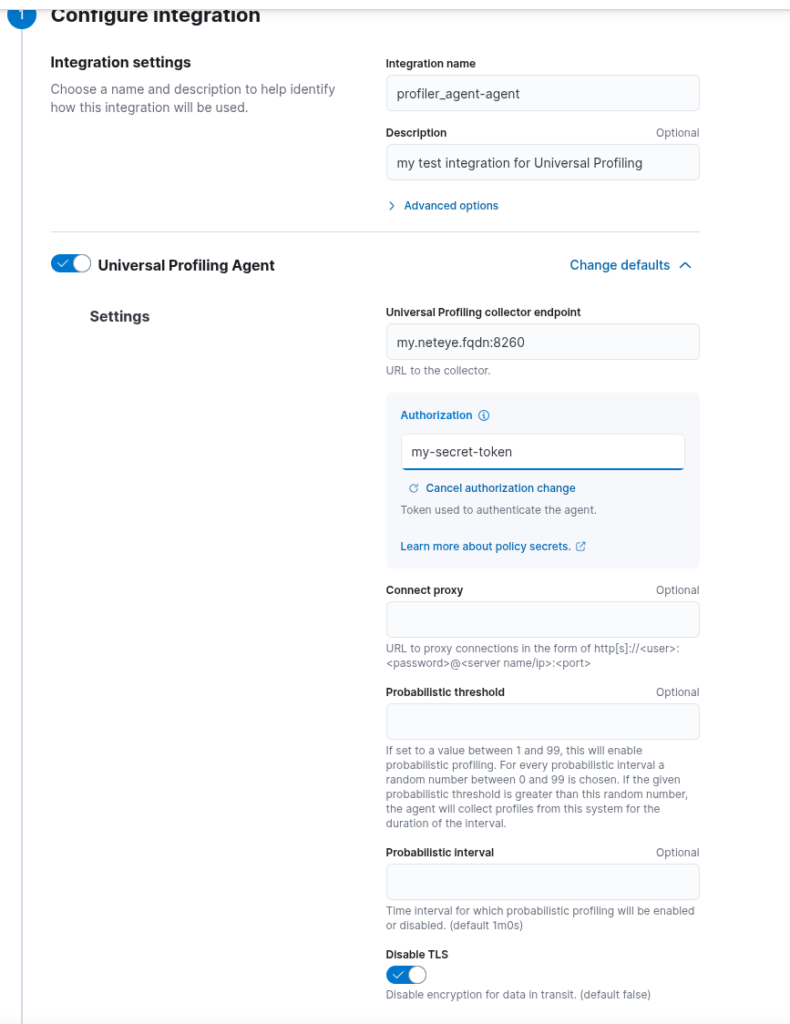
There are a number of options to run the Profiling Agent on the machine you want to profile, but if you already have an Elastic Agent running on that machine, the easiest solution is to add Universal Profiling Agent integration to that Elastic Agent via Kibana Fleet.
Go to Kibana > Fleet and add the Universal Profiling Agent integration to the policy of the Elastic Agent running on the machine you want to profile. The mandatory settings to add are the Universal Profiling collector endpoint, which you should fill in with the FQDN of your NetEye instance, plus the port on which the Profiling Backend is running (by default 8260) and the secret token that you previously set in the pf-elastic-collector.yml configuration file.
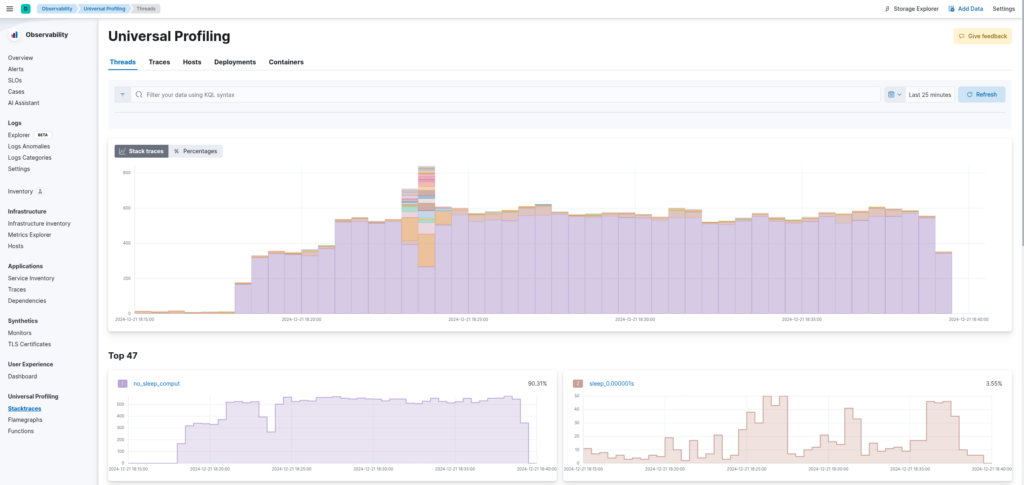
Explore your profiling data
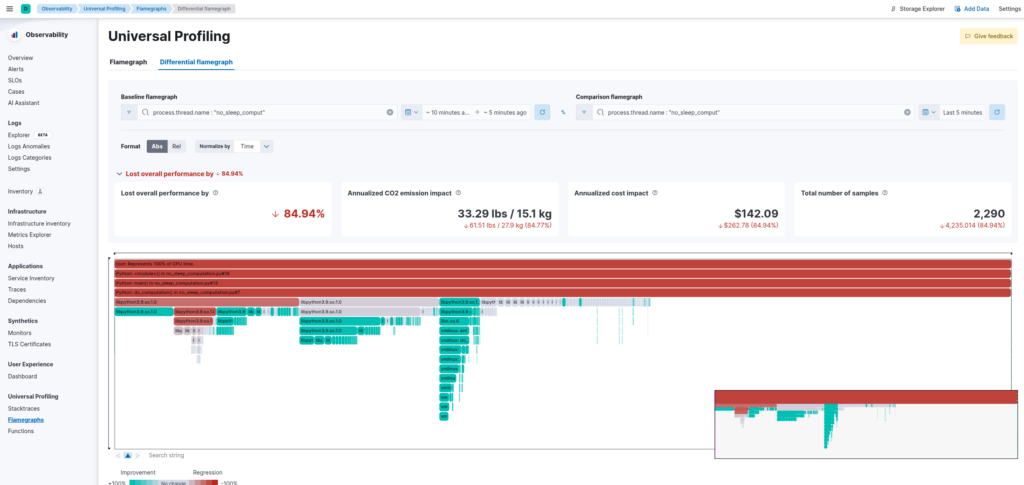
At this point your Profiling Agent should successfully send its profile data to Elastic, which you can explore in Kibana. You’ll have an overview of the most demanding processes in your infrastructure, (1) letting you see if there are unexpected spikes of CPU utilization:
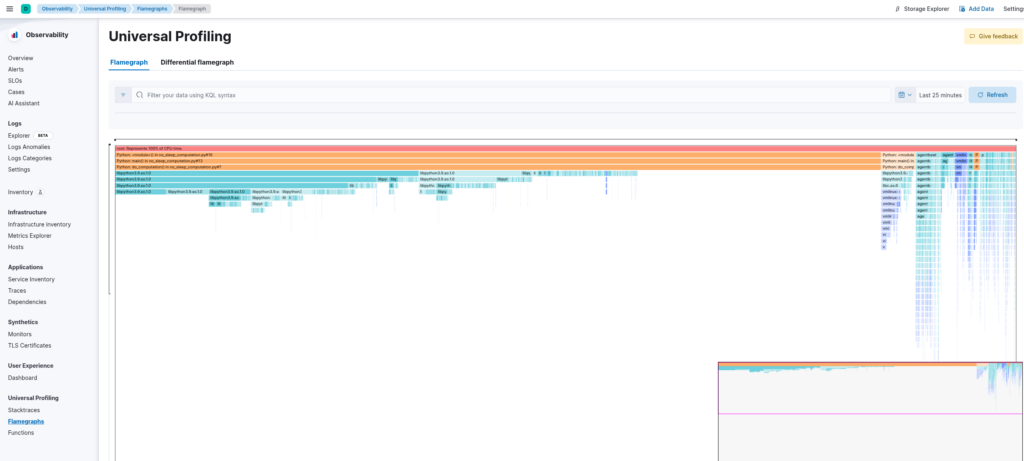
(2) dive into which functions are using most of your CPU thanks to the dedicated flamegraphs:
and (3) compare the CPU usage of your applications over time to check for possible performance degradation:
These Solutions are Engineered by Humans
Did you find this article interesting? Does it match your skill set? Our customers often present us with problems that need customized solutions. In fact, we’re currently hiring for roles just like this and others here at Würth Phoenix.