
06. 10. 2025
Beatrice Dall'Omo
Red Team, SEC4U
Vulnerability Trends & Metrics: Monthly Company Report

Effective Vulnerability Management doesn’t end with detection, it ends with action. And to take the right action, you need clear, accurate, and timely reports. In today’s fast-moving threat landscape, reporting is not just a formality, it’s a critical bridge between scan data and strategic security decisions.
This article explores the role of reporting within the Vulnerability Management life-cycle, highlighting how well-structured reports can support prioritization, accountability, compliance, and communication across technical and non-technical teams. Whether you’re securing a small environment or managing enterprise-level infrastructure, understanding how to create and effectively use vulnerability reports is fundamental to reducing risk and strengthening your security posture.
To support this, we’ve developed a reporting process focused on aggregating and analyzing enriched vulnerability data produced from the enrichment process implemented earlier. By correlating raw findings with threat intelligence, dynamic risk (KEV, EPSS), exploitability and public exposure, we’ve created reports providing Business Partners of the Würth Group with a comprehensive view of their situation regarding issues and vulnerabilities.
This article outlines how each report for each Business Partner was implemented, what metrics and trends it highlights, and how it helps drive more informed decisions.
Report Overview: Structure and Content
A well-structured vulnerability report is more than just a list of findings, it’s a communication tool that helps translate technical issues into actionable insights. In addition to technical details, the reports include aggregated data and trend analysis, offering a high-level view of the organization’s security posture, and helping to identify which areas or assets require the most attention.
In the following paragraphs, we’ll break down the main sections and explain how each one contributes to the overall goal of reducing security risk.
Company reports are created starting from data placed in the Elastic instance. Using KQL and ES|QL queries, the data of interest are extracted to create reports that are then shared monthly with the related Business Partner.
After an initial introduction section describing the process, how the Remediation Priority Index is calculated and the Objective and Use Cases of the report, other sections continue with tables, histograms, and pie charts. These allow us to visually communicate trends of vulnerabilities, both public and private, over the preceding months. Additional details have been reported for those vulnerabilities that, after enrichment, have been assigned with a critical Remediation Priority Index.
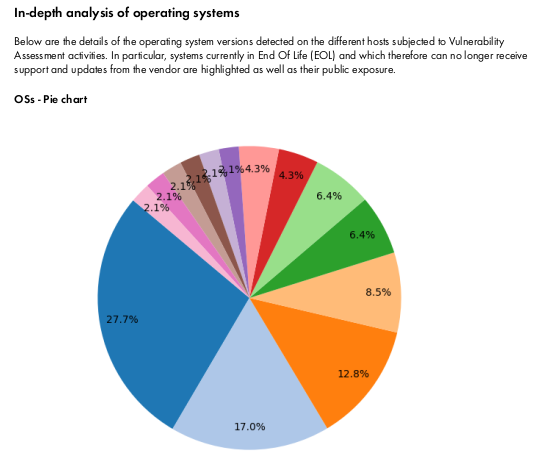
Later sections of the report delve into more specific areas, including a breakdown of the most frequently observed CVEs, an overview of the systems most heavily impacted along with an assessment of their potential public exposure, and a review of the operating systems in use. Particular attention is for those systems that are either reaching end-of-life (EOL) or are externally accessible.
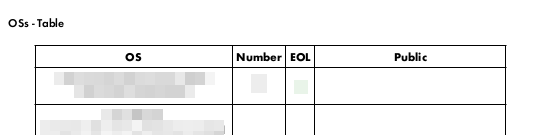
One example is the pie chart below with the accompanying table: the chart shows the distribution of the various operating systems detected, while the table contains details on each, highlighting whether it’s an operating system reaching EOL and whether it’s exposed to the public. This helps to better identify the systems that need more attention.
These deeper analyses help prioritize remediation efforts by highlighting the most critical vulnerabilities and the assets that represent the highest risk.
Building Awareness, Achieving Results
This report has several objectives, including fostering a broader understanding of the Vulnerability Management process and encouraging a shift in mindset: from viewing remediation as a one-time activity to embracing it as a continuous, structured process. By providing clear insights and actionable data, the report aims to support informed decision-making, enabling more efficient remediation efforts and minimizing the time window for potential vulnerability exploitation.
During these first runs we’ve received a significant amount of feedback from end users. This is not only a positive indicator of engagement, but also a sign of growing awareness and commitment to security across Business Partners.
We take this feedback seriously and are continuously working to enhance the value of the reports. Even from month to month, we are introducing explanations, clearer descriptions, additional data, and new sections. Each change is designed to make the reports more accessible, actionable, and aligned with our Business Partners’ evolving needs.
Ultimately, our aim is to ensure that these reports serve not only as a snapshot of current vulnerabilities, but as a practical tool to guide prioritization, support remediation efforts, and strengthen overall security posture by proactively reduce risk.
These Solutions are Engineered by Humans
Did you learn from this article? Perhaps you’re already familiar with some of the techniques above? If you find cybersecurity issues interesting, maybe you could start in a cybersecurity or similar position here at Würth IT Italy.

Beatrice Dall'Omo
Red Team & Offensive Security Specialist | Cybersecurity Team | Würth IT Italy
Author
Latest posts by Beatrice Dall'Omo
19. 12. 2025
SATAYO
Automating Report Sharing with Microsoft Graph API
27. 11. 2025
Exposure Assessment, SEC4U
See What Outsiders See: The External Attack Surface Management Report