30. 06. 2026
Azure, Cloud, Microsoft, NetEye, NetEye Extension Packs, Unified Monitoring

Nfdump mostra il traffico attraverso i dispositivi di rete e consente di visualizzare quanta banda è utilizzata per ogni singolo flusso. Questa potrebbe essere apparentemente un’informazione utile, ma in realtà, non è così significativa, infatti Nfdump elenca solamente i singoli flussi tra due porte (incluso il traffico generato) perciò è difficile capire a prima vista:
- A quale servizio appartenga il flusso
- Quanti flussi (e traffico) generino certi servizi
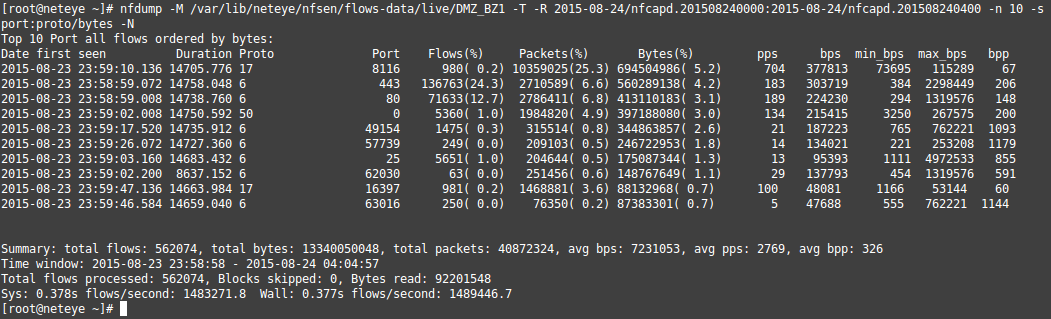
Nfdump mostra solamente il traffico tra dispositivi di rete e visualizza quanta banda viene consumata per singolo flusso.
In realtà, vogliamo sapere quale servizio genera la maggior parte del traffico in certi periodi. Per riuscire a ricavare questa informazione, dobbiamo associare il singolo flusso a certi servizi. Come è possibile impostare queste configurazioni? – In base alle porte di rete possiamo identificare, quale flusso appartiene a quale servizio. Unendo tutti i flussi, che appartengono ad un servizio, possiamo vedere a colpo d’occhio quanta banda viene utilizzata da singolo servizio.

Traffico generato da diversi servizi
Abbiamo integrato una nuova funzionalità al modulo Reporting di NetEye che consente di visualizzare il traffico generato da diversi servizi IT. Questa funzionalità permette, nella sezione Top Flow Statistics e Top In/Out Flows, di classificare i flussi in base alle porte di rete e di associarli a specifici servizi (Come HTTP, IMAP, SMTP ecc.). Oltre ai servizi di rete di default, avete anche la possibilità di identificare i vostri servizi e di associarli a specifiche porte.
Esempio: Nella vostra rete, il sistema ERP (ad esempio SAP o Microsoft Dynamics) potrebbe utilizzare tutte le porte TCP dalla 50000 alla 59999 e perciò potreste avere la necessità di associare tutti quei flussi al servizio ERP. Per impostare questa configurazione, aprite “NetEye Reporting Settings” dal menù principale nella sezione Nfdump Settings, qui potrete trovare Set Nfdump aggregation services come mostrato nell’immagine sottostante.
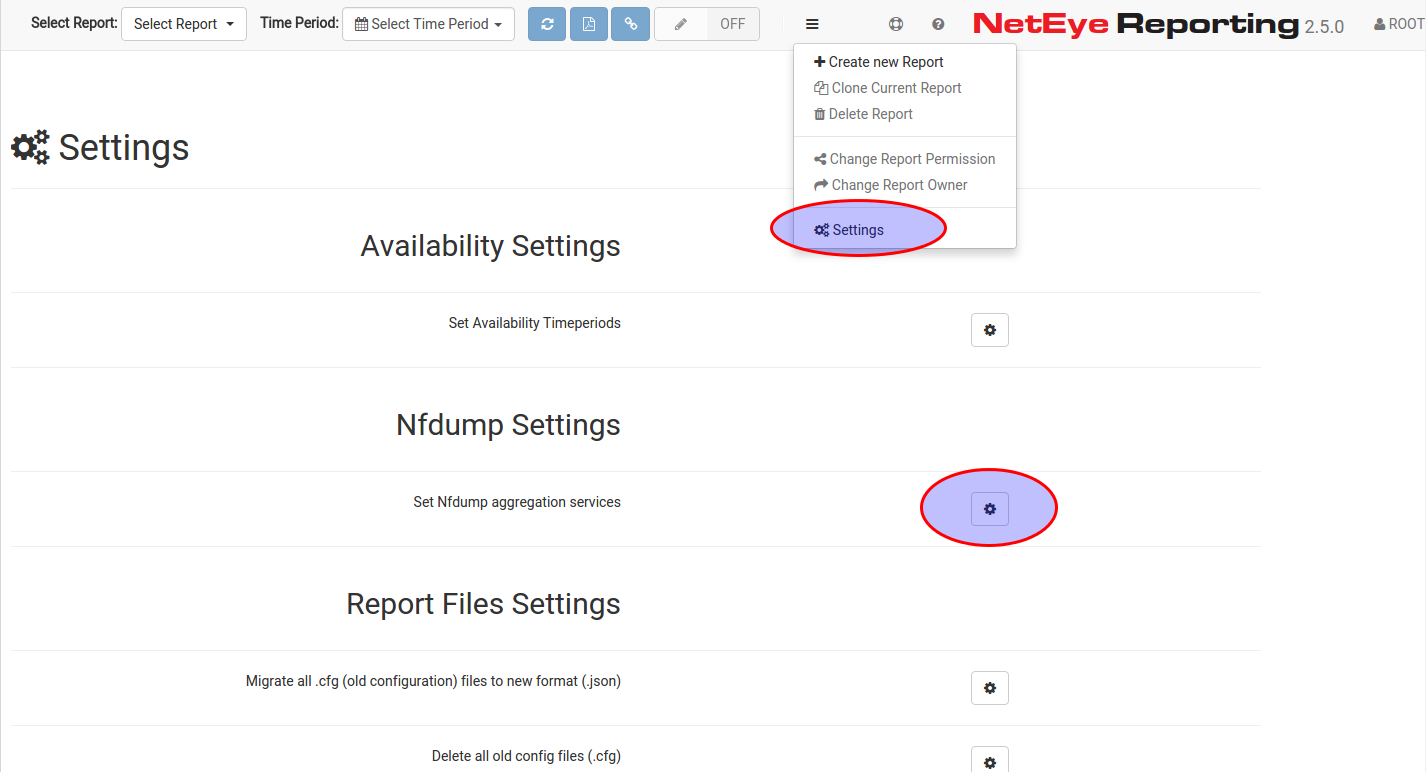
Definire le aggregazioni Nfdump [1/2]
![Define Nfdump aggregations [2/2]](http://www.neteye-blog.com/wp-content/uploads/2015/08/Selection_080.png)
Definire le aggregazioni Nfdump [2/2]

Sandro Santinato
Developer at Würth Phoenix
Hi, my name is Sandro and I am the youngest member of the Neteye team. I graduated in 2013 in Applied Computer Science at the Free University of Bolzano but I started working as software engineer at Würth-Phoenix already in May 2012. My main competence is the development and improvement of the “Real User Experience” solution.For me computer programming is not just work, but i like scripting and creating my own software also in my free time. Already as a child I was amazed by computers and their technology. So at the age of 12 I bought the book “C for dummies” and started learning programming on my own 🙂 Later on I discovered the open-source world and I started loving it from the first moment.In my free time I also like mountain biking, hiking, and of course playing the trombone in various music bands.
Author

Latest posts by Sandro Santinato
15. 11. 2017
Downloads / Release Notes, NetEye
Updated Package neteye-ocsng-2.1.2_neteye1.0.2-1 (for NetEye 3.11 + 3.10 + 3.9)
15. 11. 2017
Downloads / Release Notes, NetEye
Updated Package neteye-thruk-1.88.4_neteye1.4.21-1 (for NetEye 3.11)