10. 07. 2026
NetEye Extension Packs

26. 09. 2017
Patrick Zambelli
NetEye, Predictive Analysis, Unified Monitoring
Hyper-V monitoring: Here’s some tips!
Network traffic monitoring is traditionally based on SNMP queries. This protocol generates statistics on the transmission of data across one or more network interfaces.
While network device queries still run through SNMP, using Microsoft Hyper-V monitoring requires the adoption of other approaches. One of the reasons is the network connection configuration itself: for example, many physical network interfaces of a Hyper-V device belong to a logical interface that can also distribute network traffic to multiple network devices, such as multiple switches. Another reason for using an alternative approach is that Microsoft has abandoned the maintenance of SNMP services on their operating systems.
Consider a physical network with the following configuration: a physical Hyper-V host has two active physical network connections that are connected to the network via two switches.
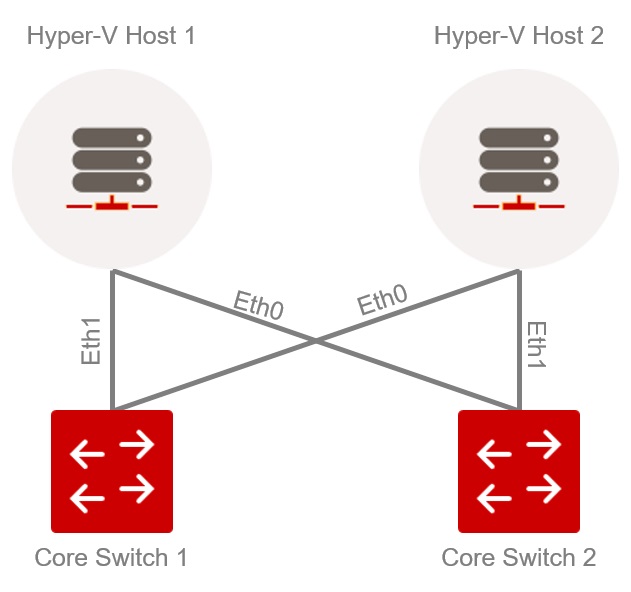
Example of a physical network
This architecture is expanded from a logical level (inside the Microsoft Hyper-V infrastructure) to an additional layer: the Hyper-V virtual network adapter. This forms the interface for the Hyper-V infrastructure to transfer data packets to the network. An example of this infrastructure might be similar to the example below.
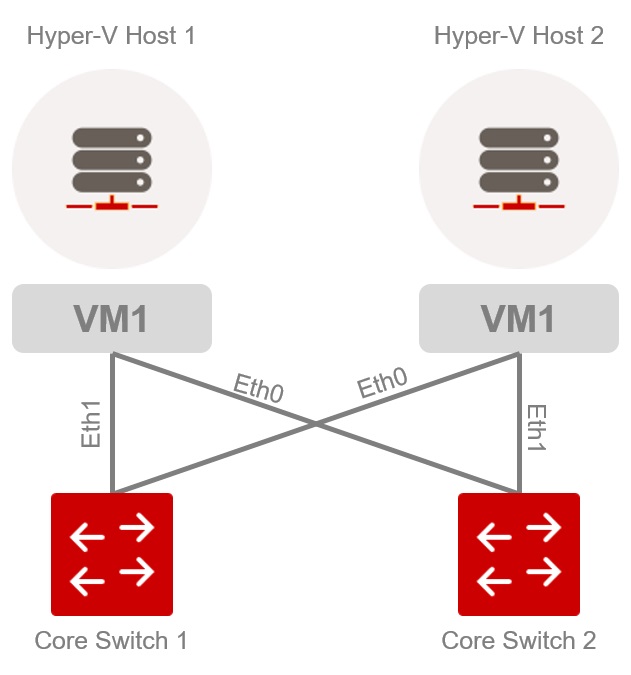
Example of a Hyper-V infrastructure network
Under this setup, it is not possible to calculate overall transfer statistics, for either the switch or the server, considering the physical interfaces. For instance, if you aggregate all inbound traffic that arrives at “Core_Switch 1”, you will get an overview of the entire Hyper-V infrastructure. However, you can’t determine the traffic generated by a single Hyper-V host, since traffic is distributed across multiple switches. That’s why it’s necessary to take logical interfaces (such as ‘VM1’ above) into account when measuring network traffic.
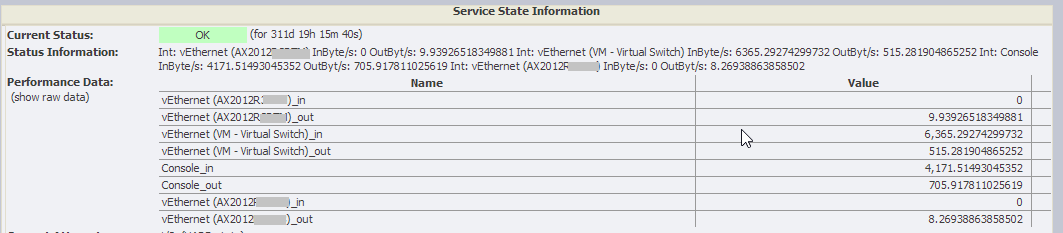
To achieve this goal, we used PowerShell commands to call a Hyper-V script via NSClient ++. This script is based on the “Get-NetAdapter” command and provides statistics for transferring all logical network interfaces through “Get-NetAdapterStatistics”. These statistics consist of byte counts and must be calculated in a subsequent step based on the intervals that have elapsed since the last call.
The result of the calculation is formatted according to Nagios standard so that they can be later displayed in NetEye.
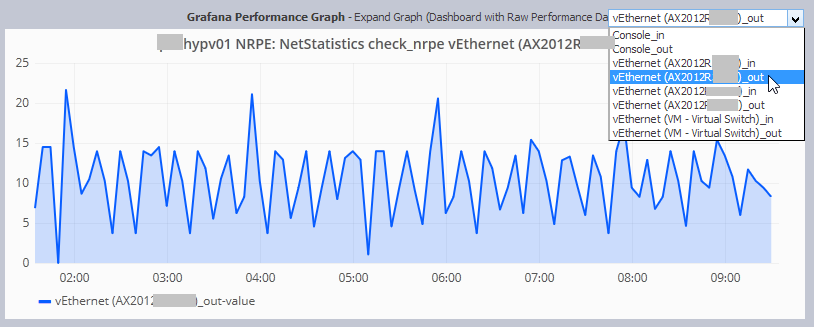
Charts are displayed with PNP4Nagios and also in the latest version of NetEye in Grafana based on the data collected in InfluxDB.
If you would like a copy of the PowerShell script and a brief NSClient ++ (version 0.4.x) configuration guide, please download the following zip file: netAdapterStatistics

Patrick Zambelli
Project Manager at Würth IT Italy
After my graduation in Applied Computer Science at the Free University of Bolzano I decided to start my professional career outside the province. With a bit of good timing and good luck I went into the booming IT-Dept. of Geox in the shoe district of Montebelluna, where I realized how a big IT infrastructure has to grow and adapt to quickly changing requirements. During this experience I had also the nice possibility to travel the world, while setting up the various production and retail areas of this company. Arrived at Würth Phoenix (now Würth IT Italy) I started developing on our monitoring solution NetEye. Today, in my position as Consulting an Project Manager I am continuously heading to implement our solutions to meet the expectation of your enterprise customers.
Author
Latest posts by Patrick Zambelli
16. 01. 2024
NetEye, Unified Monitoring
Icinga 2 DSL for Defining the Monitoring Status of Objects with Director
23. 12. 2020
NetEye
Tornado – Getting in Action with Sample Rules
05. 05. 2020
NetEye, Unified Monitoring
Import Data Correlation and Automation with Icinga2 Director