10. 06. 2026
Unified Monitoring

30. 06. 2026
Alessandro Taufer
APM, DevOps, Kubernetes
Simplifying Multi-cluster Kubernetes Monitoring with EDOT
There’s a particular kind of irony in watching your observability stack become the thing you most need to observe. That’s more or less our day job, and it’s why we tend to be unusually deliberate about tooling decisions: The small ones have a habit of compounding over time.
So when it came to choosing a monitoring solution for our Kubernetes clusters, we didn’t rush it. We evaluated the options, weighed the trade-offs, and let things settle before calling it.
Now that the dust has settled, I’m happy to share where we landed: EDOT.
What EDOT Actually Is
EDOT , the Elastic Distribution of OpenTelemetry, is Elastic’s curated build of the upstream OpenTelemetry Collector. Not a fork. Same code, same configuration model, same receivers and processors as vanilla OpenTelemetry. What Elastic adds on top is a set of opinionated defaults and ready-to-go integrations that get you up and running fast, but without locking you in.
The Helm-based install gives you logs, Kubernetes events, node and pod metrics, and control-plane signals out of the box. That’s a great floor. But the real deal shows up once you remember what’s underneath: a standard OTel Collector. Which means you get two superpowers for free.
- The Prometheus receiver turns the collector into a drop-in Prometheus scraper. Every /metrics endpoint you’ve already annotated, your ingress controller, your databases, your custom exporters, even existing ServiceMonitor resources (via the OTel Operator’s target allocator) flows straight into Elastic. No rewriting instrumentation libraries, no migration project.
- The OTLP receiver does the same for anything OTel-native. Your Go service exporting traces, your Python app pushing custom business metrics, your Node.js app shipping structured logs: They all land in the same pipeline.
And here’s the payoff: All of that custom Prometheus and OTLP data flows through the same collector that’s already enriching everything with k8s.pod.name, k8s.namespace, k8s.node.name, and the full set of OTel semantic conventions. So in Elasticsearch your application’s request latency, the pod’s memory pressure, the kubelet’s eviction event, and the cluster-level scheduling log all sit in the same store, joined on the same resource attributes, ready to be plotted on a dashboard.
The Topology
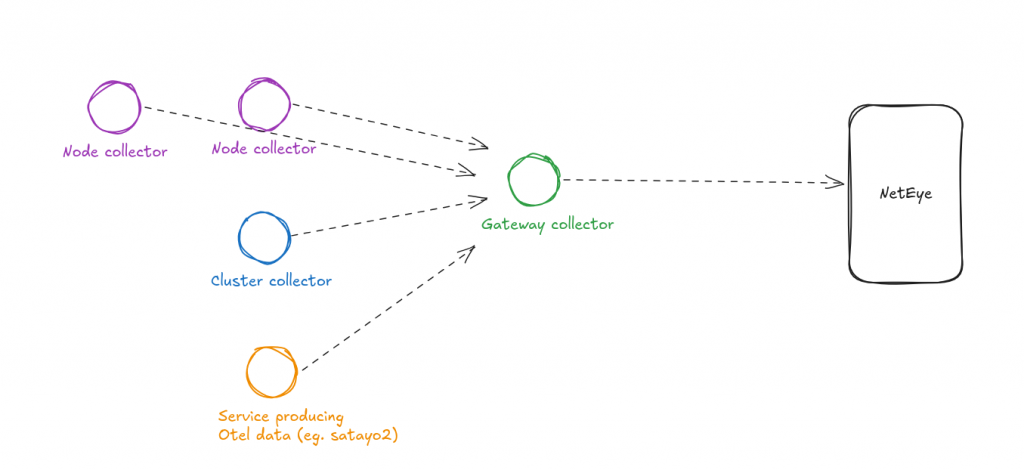
The Helm chart drops three collectors into your cluster, each with one clear job:
- Cluster collector – A single Deployment that gathers cluster-wide Kubernetes metrics and events. There’s exactly one; it’s the component that knows the cluster as a whole.
- Node collector – A DaemonSet running on every node, picking up host-level metrics and the logs of whatever’s running there.
- Gateway collector – The central aggregation point. Everything funnels through here before being forwarded to Elasticsearch on port 9200. This is where you batch, filter, route, and apply policy.
The split matters because each tier has different scaling properties. Node collectors scale with the cluster automatically. The cluster collector is a singleton watching the API server. The gateway is where you concentrate the heavy lifting: sampling decisions, enrichment, and multi-destination routing.
It’s the kind of topology that feels obvious in hindsight, but it’s nice to have it shipped as a default rather than something you have to design yourself.
From One Cluster to Many
The out-of-the-box win is what got us through the door. Every cluster gets the same three-tier deployment from the same Helm chart. Each gateway then ships to a shared Elasticsearch backend, with the cluster’s identity attached as a resource attribute (the OTel semantic convention is k8s.cluster.name, plus whatever environment tags you want to add).
That single attribute is what makes the multi-cluster experience genuinely pleasant:
Cross-cluster trace correlation is free. If a service in cluster A calls a service in cluster B, the traces stitch together because they share the same OTLP-native trace IDs. No special configuration required.
Dashboards filter by cluster automatically. The same panel definitions work for prod, pre-prod, and dev. You just change the filter value.
Alerts can be cluster-scoped or fleet-wide with the same rule set. “CPU pressure on any node in any cluster” becomes a single query.
Wrapping up
The honest reason EDOT won out for us isn’t any single feature: It’s that we never had to fight it. The defaults are sensible, the topology is the one we’d have drawn on a whiteboard anyway, and because it’s a real OTel collector underneath, nothing we’d already instrumented needed to change.
If you’re already on Elastic and running Kubernetes, there’s really no reason to be running anything else for this. If you’re not on Elastic, the same architecture works with any OTel-compatible backend by swapping the exporter.
Either way, the design is what makes the decision low-stakes: You’re not betting on a vendor, you’re betting on a protocol.
Interested in further reading? You might find this article useful!
These Solutions are Engineered by Humans
Did you find this article interesting? Does it match your skill set? Programming is at the heart of how we develop customized solutions. In fact, we’re currently hiring for roles just like this and others here at Würth IT.
Author
Latest posts by Alessandro Taufer
31. 03. 2026
DevOps, Kubernetes
Abusing Trust Boundaries between TLS and HTTP
31. 12. 2025
Development, DevOps
What Tests Can Tell You About Your Codebase
19. 09. 2025
Development, DevOps
How to Debug Your Kernel Calls