
Jeder von uns, der einen IBM AS400 Server administriert ist auch für dessen Überwachung verantwortlich.
Wenn die hierfür verwendet Monitoring Software auf Nagios basiert, wie z.B. unser NetEye, dann ist das check_as400 Plugin am besten geeignet um diese Server zu überwachen.
Das check_as400, ist ein Java-basiertes Plugin und wird über eine Telnet Verbindung mit dem as400 System verbunden.
Jeder Check der über diesen Befehl gestartet wird, analysiert die Ausgabe des as400 Monitor und wertet die Output-Strings aus. Hierbei muss jedoch die Sprache des Systems berücksichtigt werden, da sich die Output-Strings unterscheiden je nachdem ob das as400 System auf Englisch, Deutsch, Italienisch usw. eingestellt ist.
Außerdem kommt es häufig zu Timeouts, vor Allem wenn mehrere Checks gleichzeitig laufen.
Während einer meiner letzten Beratungen, haben wir einen NRPE Client für die as400 Systeme des Kunden installiert. Der NRPE Client ist sprach-unabhängig und verfügt über viele Standard-Checks. Ziemlich ähnlich wie auf Linux Systemen.
Nach der Installation des NRPE Clients auf dem as400, waren wir in der Lage die as400 Checks über den Standard check-nrpe Befehl, von NetEye aus zu starten.
So ist es auch viel einfacher die Checks zu erstellen.
Hier einige Beispiele:
Monitoring von QINTER QSYS
/usr/lib/nagios/plugins/check_nrpe -n -t 50 -H {as400 IP} -c i5_check_subsystem -a QINTER QSYS
Monitoring der CPU-Auslastung
/usr/lib/nagios/plugins/check_nrpe -n -t 50 -H {as400 IP} -c i5_cpu_load -a 99 100
Monitoring des Plattenspeichers
/usr/lib/nagios/plugins/check_nrpe -n -t 50 -H {as400 IP} -c i5_asp_used -a -1 85 90
Monitoring des QSYSWRK Subsystems
/usr/lib/nagios/plugins/check_nrpe -n -t 50 -H {as400 IP} -c i5_check_subsystem -a QSYSWRK QSYS
Monitoring der Platten-Ausfälle
/usr/lib/nagios/plugins/check_nrpe -n -t 50 -H {as400 IP} -c i5_asp_disk -a -1
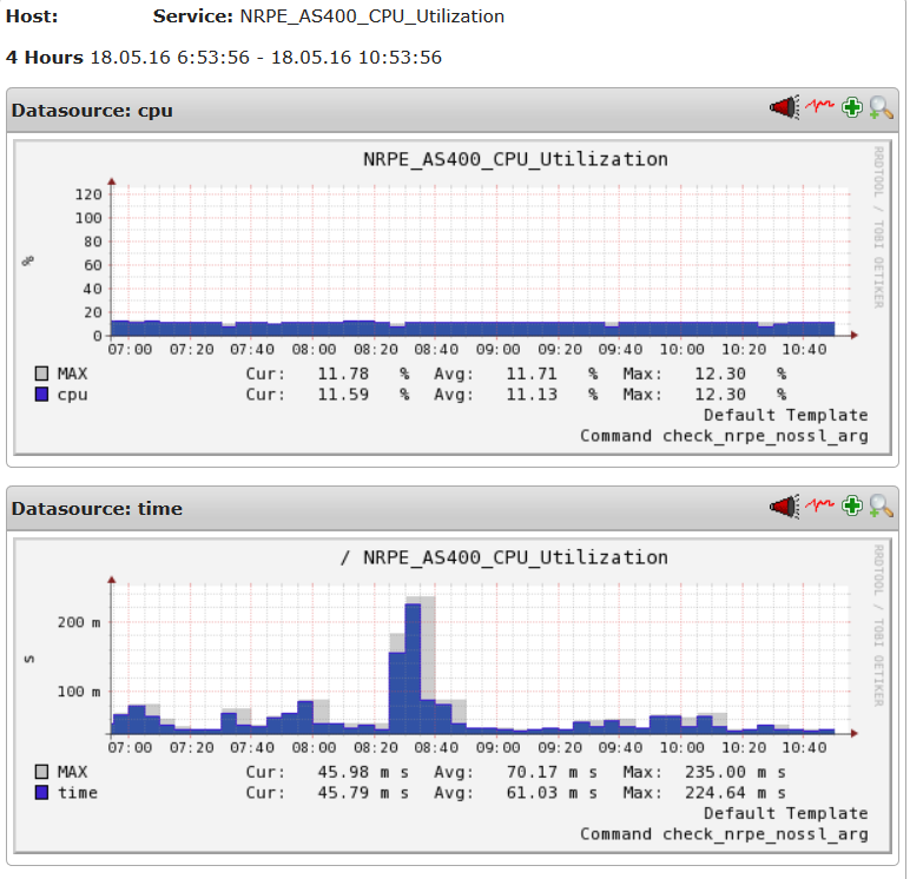
Im folgenden Bild sehen Sie einige NRPE Checks für as400 Systeme, welche über unser NetEye (auf Nagios basierende Lösung) gestartet wurden.
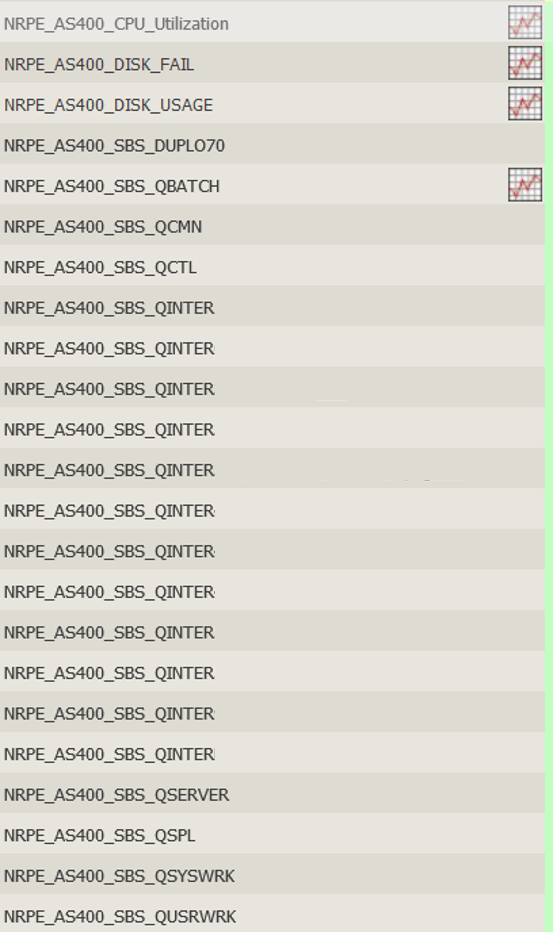
Der Output dieser Checks liefert Performancedaten, welche automatisch über die unten stehenden Grafiken in NetEye dargestellt warden.
Durch den Einsatz der –a (arguments) Option sind Sie in der Lage mit check_nrpe Schwellenwerte, Subsysteme usw. zu definieren.
Ich habe eine Liste von Plugins angehängt, welche bei der Installation des NRPE Clients auf as400 verfügbar sind (hier geht’s zum Dokument). Leider ist dieses Dokument aktuell nur auf Italienisch verfügbar, aber ich hoffe es ist trotzdem halbwegs verständlich. Andernfalls, können Sie uns gerne für weitere Erklärungen kontaktieren.
Fazit:
Durch den Einsatz des as400 NRPE Clients profitieren sie von folgenden Vorteilen:
- Sprach-unabhängig
- Lösung des Timeout-Problems wenn auf einem System mehrere Checks gleichzeitig laufen
- Nutzung des Standard NRPE Protokolls zum Checken von as400 Systemen
- Der NRPE Client gibt Performancedaten aus
- Einfache Implementierung der Checks, durch die Nutzung von NRPE Standard Befehlen


Tobias Goller
NetEye Solution Architect at Würth IT Italy
I started my professional career as a system administrator.
Over the years, my area of responsibility changed from administrative work to the architectural planning of systems.
During my activities at Würth IT Italy, the focus of my area of responsibility changed to the installation and consulting of the IT system management solution WÜRTHPHOENIX NetEye.
In the meantime, I take care of the implementation and planning of customer projects in the area of our unified monitoring solution.
Author
Latest posts by Tobias Goller
16. 02. 2026
Unified Monitoring
OpenShift Monitoring in NetEye
13. 10. 2025
Log-SIEM, Unified Monitoring
Elastic Defend: Experiences
18. 07. 2025
Automation, Cloud
Running SOS Berlin JobScheduler in Containers: A Step Toward Cloud-Native Scheduling
16. 04. 2025
NetEye, Unified Monitoring
Application Performance Monitoring in NetEye with Elastic APM and OpenTelemetry