12. 06. 2025
NetEye, Unified Monitoring

On one hand we have Alyvix 3, our visual monitoring tool for continuously tracking the user experience.
We’ve also just released Alyvix 3 Server, which lets us easily schedule and administer our test cases.
And we also have our NetEye monitoring system.
In this blog, I’d like to show you how we can integrate all three elements.
In order to do this we’ll use a script created by our guru Jürgen Vigna. Thank you Jug! (https://www.neteye-blog.com/jurgenvigna_wuerthphoenixneteye/) This Perl script lets us contact Alyvix Server, and can be run either on the master or on the satellite, depending on where Alyvix Server is located.
The logical steps to configure this integration are:
- Install Alyvix 3 on a Windows server (following the documentation at https://www.alyvix.com/learn/getting_started/install.html)
- Install Alyvix Server on the same Windows server (following the documentation at https://alyvix.com/learn/server/install.html)
- Configure the script created by Jürgen Vigna to interact with our Alyvix Server
- Import the dashboards we need to analyze our test cases
Here are the results after configuring a satellite by running the script on the Windows 10 client:
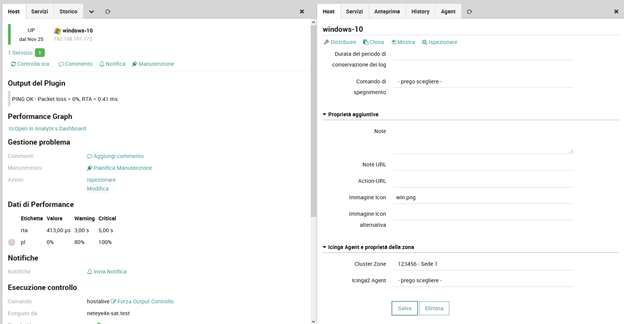
Every time that the service runs, we collect the metrics on Alyvix Server, and then with our script we pull those metrics into our NetEye Master:
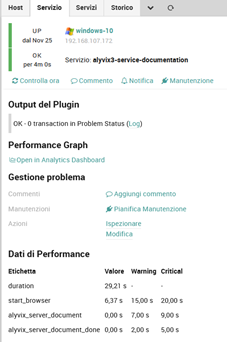
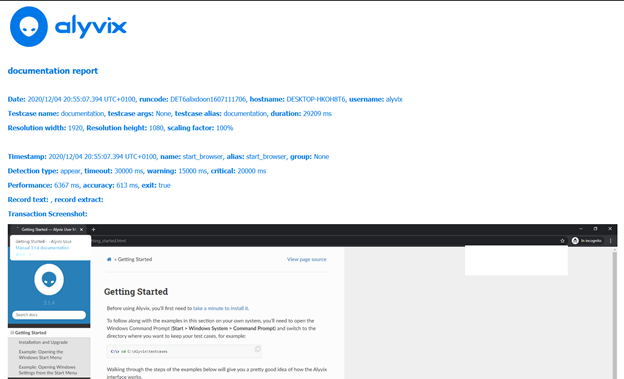
This test case is very simple − it just collects anonymous metrics about navigation through the Alyvix 3 documentation. In the output of the service I have a link to the Alyvix Server report that shows the log of the test case run:
And if the test case doesn’t run, then we see the log with the error:

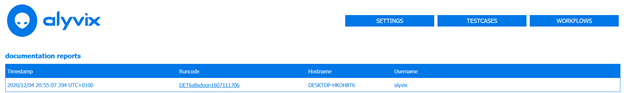
It’s possible to get the history of the test case since the logs are stored on Alyvix Server. We can find it on Alyvix Server either as a report (HTML) or via the API (JSON).
Here we’ll show how to schedule a test case by creating an example called “documentation”. It’s very simple:
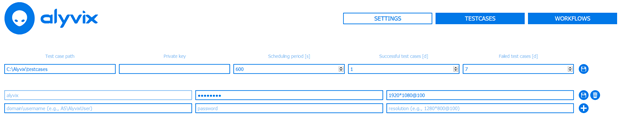
- Open the Alyvix Server home page and edit the settings:
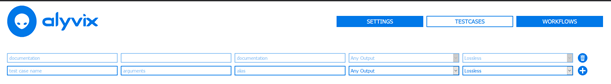
2. In the Testcases tab we set the test cases to schedule:
3. In the last tab we set the workflow choosing the test cases

4. In the end we have this situation for our test on the Workflows tab:
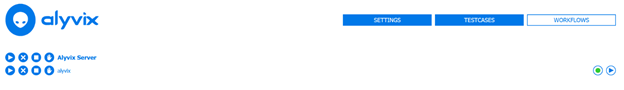
In this state we can stop and (re)start the workflow, and the red or green circle will show us if the selected test case is running (red) or is waiting to run (green). If instead it’s gray, there’s a problem that needs to be investigated.
Finally, we have our Grafana dashboard that collects the Alyvix test case metrics:
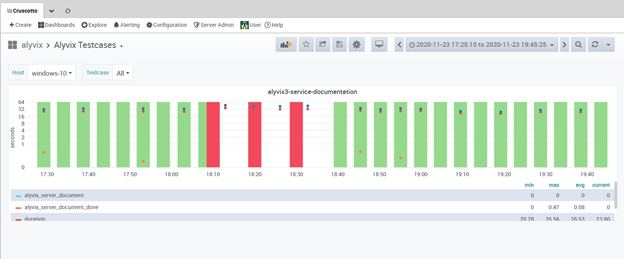
If you have a large number of test cases and multiple servers, it’s possible to aggregate this information, allowing us to see where the test cases were in error and where they were okay.
Franco Federico
Hi, I’m Franco and I was born in Monza. For 20 years I worked for IBM in various roles. I started as a customer service representative (help desk operator), then I was promoted to Windows expert. In 2004 I changed again and was promoted to consultant, business analyst, then Java developer, and finally technical support and system integrator for Enterprise Content Management (FileNet). Several years ago I became fascinated by the Open Source world, the GNU\Linux operating system, and security in general. So for 4 years during my free time I studied security systems and computer networks in order to extend my knowledge. I came across several open source technologies including the Elastic stack (formerly ELK), and started to explore them and other similar ones like Grafana, Greylog, Snort, Grok, etc. I like to script in Python, too. Then I started to work in Würth Phoenix like consultant. Two years ago I moved with my family in Berlin to work for a startup in fintech(Nuri), but the startup went bankrupt due to insolvency. No problem, Berlin offered many other opportunities and I started working for Helios IT Service as an infrastructure monitoring expert with Icinga and Elastic, but after another year I preferred to return to Italy for various reasons that we can go into in person 🙂 In my free time I continue to dedicate myself to my family(especially my daughter) and I like walking, reading, dancing and making pizza for friends and relatives.
Author
Latest posts by Franco Federico
10. 06. 2026
Unified Monitoring
Transform Metrics into Alerts
10. 03. 2026
Unified Monitoring
Elastic AutoOps in NetEye: Simplifying Elasticsearch Operations with Real-Time Intelligence
09. 09. 2025
NetEye
Backing up a MariaDB Galera Cluster
12. 06. 2025
NetEye, Unified Monitoring
From Monitoring to SOC