


01. 12. 2025
NetEye, Unified Monitoring

28. 04. 2023
Juergen Vigna
Icinga Web 2, NetEye, Unified Monitoring
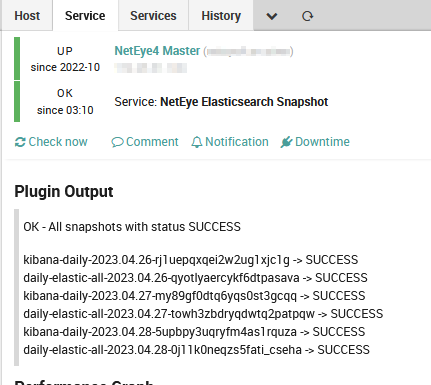
Elasticsearch Snapshots and How to Monitor Them
If you have a NetEye with SIEM Module activated or own an Elasticsearch installation then you have surely activated the Elasticsearch Snapshots to make backups of all your indexes (or at least the important ones). However you have to take a regular look at your Snapshots Reports to check that everything is working correctly. I recently thought about using the Elasticsearch Snapshot API to automate this task and have a monitoring plugin check your Snapshot status.
To set this up, download this plugin: check_elasticsearch_snapshots.zip and define a command like this one:
/neteye/shared/monitoring/plugins/check_elasticsearch_snapshots.sh -r elastic-backup-repositoryYou can also look at the command help for more options:
# /neteye/shared/monitoring/plugins/check_elasticsearch_snapshots.sh --help
check_elasticsearch_snapshots 1.0.0

This plugin checks for the status of elasticsearch snapshots

Usage:
  check_elasticsearch_snapshots.sh -r <snapshot_repository_name> [ -s <snapshot_basename> ] [-d <number-days-back>]
  check_elasticsearch_snapshots.sh --help
  check_elasticsearch_snapshots.sh --version
-r <snapshot_repository_name> ... name of elasticsearch snapshot backup repostiory
-s <snapshot_basename>        ... base name of snapshop to check for (default: ALL)
-d <number-days-back>         ... numbers of days back to look for status of snapshots (default: 3)
After that define your Service Template and Service, and you can begin monitoring your Elasticsearch Snapshots.
These Solutions are Engineered by Humans
Did you like this article? Does it reflect your skills? We often get interesting questions straight from our customers who need customized solutions. In fact, we’re currently hiring for roles just like this and others here at Würth Phoenix.

Juergen Vigna
NetEye Solution Architect at Würth IT Italy
I have over 20 years of experience in the IT branch. After first experiences in the field of software development for public transport companies, I finally decided to join the young and growing team of Würth Phoenix (now Würth IT Italy). Initially, I was responsible for the internal Linux/Unix infrastructure and the management of CVS software. Afterwards, my main challenge was to establish the meanwhile well-known IT System Management Solution WÜRTHPHOENIX NetEye. As a Product Manager I started building NetEye from scratch, analyzing existing open source models, extending and finally joining them into one single powerful solution. After that, my job turned into a passion: Constant developments, customer installations and support became a matter of personal. Today I use my knowledge as a NetEye Senior Consultant as well as NetEye Solution Architect at Würth Phoenix.
Author
Latest posts by Juergen Vigna
22. 05. 2025
NetEye, Unified Monitoring
Automatic Integration of NagVis Map into Icinga Web 2/NetEye Monitoring