15. 12. 2025
Icinga Web 2, NetEye, Unified Monitoring

24. 01. 2025
Juergen Vigna
ITOA, NetEye, Unified Monitoring
Monitoring NetApp Storage Devices over a RESTful API
NetApp® ONTAP® 9.6 and later versions include support for an expansive RESTful web services API. In comparison to an ONTAPI® application, the REST API offers a vastly simplified and workflow-driven user experience, allowing you to perform multiple operations on the storage objects with a single API. REST is the industry standard for API development, and the ONTAP REST API provides a great opportunity to automate your storage deployments.
I could basically only find the Centreon NetApp REST-API plugin which does do a number of things, but as it couldn’t do everything we needed, I had to write two more plugins. So the plugins we use now for the NetApp Monitoring are the following:
- centreon_netapp_ontap_restapi.pl
- check_netapp_api_cluster_network.pl
- check_netapp_api_node_disk_totals.pl
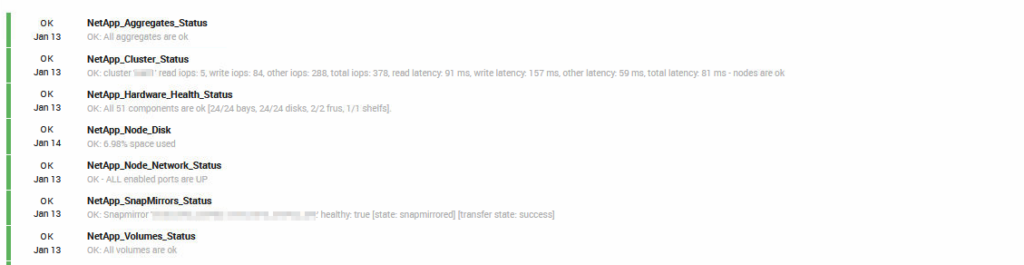
The monitoring Service Commands we use with NetEye for the above Services are the following:
- NetApp Aggregate Status:
/usr/lib/centreon/plugins/centreon_netapp_ontap_restapi.pl --api-password 'password' --api-username 'user' --hostname <hostname|ip> --insecure --mode aggregates --verbose
- NetApp Cluster Status:
/usr/lib/centreon/plugins/centreon_netapp_ontap_restapi.pl --api-password 'password' --api-username 'user' --hostname <hostname|ip> '-insecure --mode cluster --statefile-dir /neteye/shared/icinga2/data/lib/centreon-plugins --verbose
- NetApp Hardware Health Status:
/usr/lib/centreon/plugins/centreon_netapp_ontap_restapi.pl --api-password 'password' --api-username 'user' --hostname <hostname|ip> --insecure --mode hardware --verbose
- NetApp Node Disk:
/neteye/shared/monitoring/plugins/check_netapp_api_node_disk_totals.pl -H <hostname|ip> -c 90 -f -p 'password' -u 'user' -w 80
- NetApp Node Network Status:
/neteye/shared/monitoring/plugins/check_netapp_api_cluster_network.pl -H <hostname|ip> -e 'e0a|e0b' -f -p 'password' -r -u 'user' -v
- NetApp SnapMirrors Status:
/usr/lib/centreon/plugins/centreon_netapp_ontap_restapi.pl --api-password 'password' --api-username 'user' --hostname <hostname|ip> --insecure --mode snapmirrors --verbose
- NetApp Volumes Status:
/usr/lib/centreon/plugins/centreon_netapp_ontap_restapi.pl --api-password 'password' --api-username 'user' --critical-usage-prct 90 --filter-vserver-name '^(?!.*_DR).*' --hostname <hostname|ip> --insecure --mode volumes --verbose --warning-usage-prct 80
We then created some ITOA dashboards for all the performance data we get; here’s an example for the Volumes Dashboard:
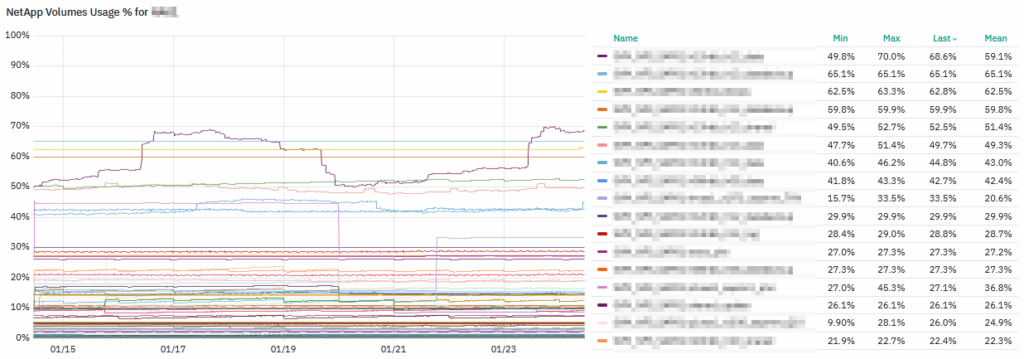
So with this I guess you have all the necessary information to be able to add your own NetApp RESTful API Monitoring inside your monitoring system.
These Solutions are Engineered by Humans
Did you find this article interesting? Does it match your skill set? Our customers often present us with problems that need customized solutions. In fact, we’re currently hiring for roles just like this and others here at Würth Phoenix.

Juergen Vigna
NetEye Solution Architect at Würth IT Italy
I have over 20 years of experience in the IT branch. After first experiences in the field of software development for public transport companies, I finally decided to join the young and growing team of Würth Phoenix (now Würth IT Italy). Initially, I was responsible for the internal Linux/Unix infrastructure and the management of CVS software. Afterwards, my main challenge was to establish the meanwhile well-known IT System Management Solution WÜRTHPHOENIX NetEye. As a Product Manager I started building NetEye from scratch, analyzing existing open source models, extending and finally joining them into one single powerful solution. After that, my job turned into a passion: Constant developments, customer installations and support became a matter of personal. Today I use my knowledge as a NetEye Senior Consultant as well as NetEye Solution Architect at Würth Phoenix.
Author
Latest posts by Juergen Vigna
22. 05. 2025
NetEye, Unified Monitoring
Automatic Integration of NagVis Map into Icinga Web 2/NetEye Monitoring