


02. 02. 2026
Downloads / Release Notes, NetEye, Unified Monitoring

01. 08. 2025
Emil Fazzi
Downloads / Release Notes, NetEye, Unified Monitoring
NetEye 4.43 Release Notes

Welcome to version 4.43 of our NetEye v4 Unified Monitoring Platform.
As you log in, you’ll be greeted by a sunlit glimpse of Chiusa (Klausen), where pastel‑hued houses cling to the steep valley walls and the ancient cathedral bell tower stands sentinel over the winding streets. Below, the Eisack River threads its way through the town’s cobbled alleyways, while the historic Säben rock walls rise in the distance, hinting at centuries of Alpine heritage.
General
MariaDB Galera Observability
With this release, NetEye introduces enhanced observability for monitoring the health and performance of Galera clusters. A default dashboard is now available in the ITOA module, providing clear visualization of each node’s status and database queries activity across the cluster. This makes it easier to detect lagging nodes or potential bottlenecks immediately after upgrading. Additionally, a new Icinga2 check has been added to monitor the average replication queue size, triggering alerts when thresholds are exceeded to promptly highlight any replication issues.
NetEye Cluster on Microsoft Azure
Now it’s possible to deploy a NetEye Cluster on Microsoft Azure. To guide you through the process, we’ve published a detailed step-by-step tutorial for setting it up, available as a How-To in the NetEye User Guide. In response to Azure-specific requirements (such as its probe mechanism), we’ve also introduced a few targeted enhancements to NetEye.
NetworkManager
As part of our ever-evolving effort to modernize system management, in this release, we are migrating from the legacy network-scripts to the more robust and feature-rich NetworkManager. For more details and documentation about this procedure, please check out our User Guide.
Monitoring
Icinga2 upgrade to 2.15.0
To prepare the environment for the future inclusion of Icinga DB in NetEye, version 4.43 delivers the upgrade of Icinga2 to 2.15.0, which primarily introduces support for Icinga2 dependencies in Icinga DB, improves the stability and robustness of the integration with Tornado, and includes numerous bug fixes, feature enhancements, and improvements to code quality. For more details on this upgrade, please take a look at the official release notes.
ITOA
Grafana has been upgraded from version 11.6 to 12.0.2. This version introduces Git Sync to manage the dashboard as code and enhances drilldown across metrics and logs. NetEye now also ships the grafana-image-renderer plugin, used for generating the SLM Resource reports. See the Grafana 12 release notes for more details.
⚠️ Note: Some third-party plugins may not be compatible with Grafana 12. Review and update them before upgrading.
NetEye Elastic Stack
Kibana Multi-instance
With the NetEye 4.43 upgrade, Kibana will transition from PCS‑managed resources to our new distributed, multi‑instance architecture. This change not only boosts Kibana’s reliability on cluster installations but also balances workloads more efficiently across all nodes. To ensure a consistent experience, single‑node deployments will undergo the same migration, bringing improved infrastructure stability and enhanced security for the Kibana instance. You can find additional information about breaking changes and migration procedure details in the dedicated section of the NetEye User Guide.
APM – User Experience
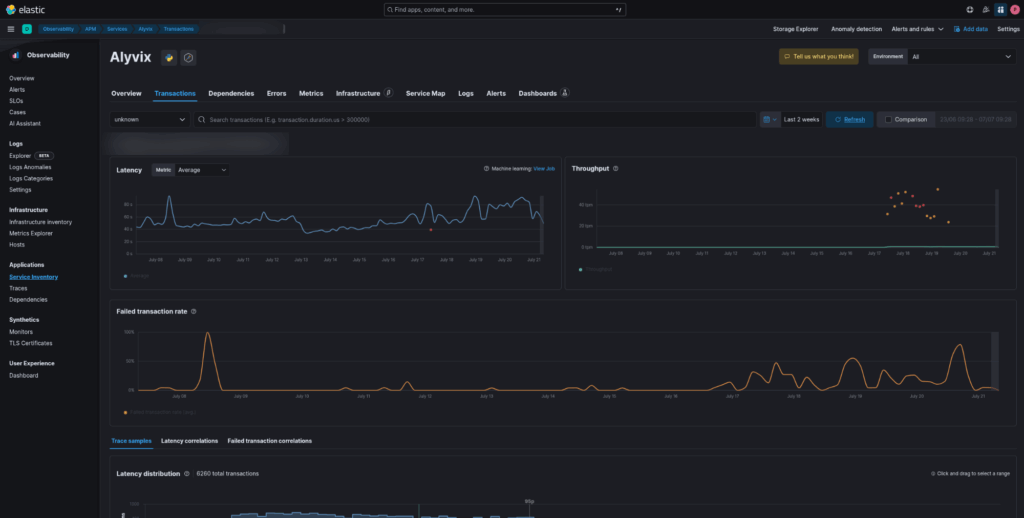
Alyvix – Elastic Integration
When an Alyvix Test Case detects a performance degradation in one of your services, it is essential to correlate the data from the Alyvix Test Case with the logs, metrics, and traces from your infrastructure. This correlation enables you to identify the root cause of the degradation and address the issue effectively for your users.
To facilitate this process, if you are utilizing the Elastic Stack to gather data from your environment, NetEye 4.43 allows you to also send Alyvix metrics to Elastic. This integration consolidates all your data within Elastic, making it easier to correlate information.
Furthermore, incorporating Alyvix data into Elastic opens up the opportunity to leverage Elastic’s powerful tools, such as Machine Learning, to analyze your Alyvix data comprehensively.
You can easily access Alyvix Test Case data in the form of traces within the Observability APM solution of Kibana.
NetEye User Guide
Elastic Security – XDR
With the new 4.43 version of the online NetEye User Guide, we’re introducing an insight into the XDR capabilities of Elastic. While the solution of Elastic Security has already been available in previous versions of NetEye, and is not new to NetEye 4.43 users, the update of the user guide intends to explain how XDR integration enhances threat detection and response, providing users with greater visibility and context for improved security operations.
Emil Fazzi
Software Developer, R&D Team in the "IT System & Service Management Solutions" group at Würth IT Italy.