
Among the several plugins that Grafana provides is Node Graph, a useful plugin for visualizing elements and relationships between them. This plugin, as described in the article: https://grafana.com/docs/grafana/latest/panels-visualizations/visualizations/node-graph/ , can be used to represent:
- Solution topologies
- Networks
- Infrastructure
- Organizational charts
- Critical path diagrams
- …
To verify its usefulness within NetEye, we adapt it to the data present in Icinga. In this POC, we import our hosts as “Nodes” and their dependencies as “Edges” in order to allow a “dynamic” mapping. Using the schema proposed in this article, we create Nodes and Edges with their mandatory fields (columns with * are mandatory fields).
Example of the structure of the “Nodes”
| id* | Title | subtitle | mainstat | secondarystat | color | icon | highlighted |
| node1 | PC | Windows | AMD | 16gbRAM | blue | true | |
| node2 | PC | Linux | Intel | 32gbRAM | green | eye | false |
| node3 | Mac | MacOS | M3 | 16gbRAM | gray | apps | false |
Example of the structure of the “Edges”
| id* | source* | target* | mainstat | seconddarystat | thickness | highlighted | Color |
| edge1 | node1 | node2 | TheMain | TheSub | 3 | true | cyan |
| edge2 | node3 | node2 | Main2 | Sub2 | 1 | false | orange |
So we start by using Icinga as a data source and build a query that extracts the hosts to use as “Nodes”. The “Query” relates these 3 tables from the database:
- icinga_hosts
- icinga_objects
- icinga_hoststatus
SELECT
  i_o.object_id AS id
  , i_o.name1 AS title
  , i_h.address AS subtitle
  , CASE
    WHEN i_h_s.current_state = 0 THEN "[UP]"
    WHEN i_h_s.current_state = 1 THEN "[DOWN]"
    ELSE "[UNKNOWN]"
    END AS mainstat
  , i_h_s.output AS secondarystat
  , CASE
    WHEN i_h_s.current_state = 0 THEN "green"
    WHEN i_h_s.current_state = 1 THEN "red"
    ELSE "purple"
    END AS color
  , "cube"  AS icon
  , false AS highlighted
from icinga_hosts i_h
 LEFT JOIN icinga_objects i_o ON i_h.host_object_id=i_o.object_id
 LEFT JOIN icinga_hoststatus i_h_s ON i_h.host_object_id=i_h_s.host_object_id;
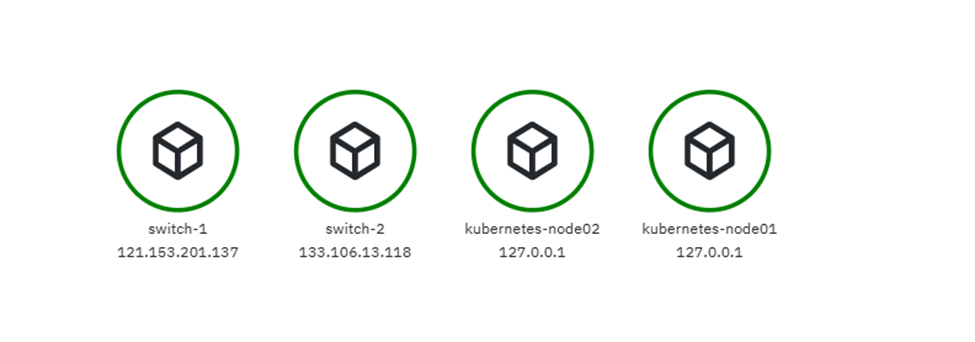
The result of running this is the list of the 4 test hosts present in our NetEye Installation.
To test links between objects we simulate parent-child dependencies in Icinga with NEP activated such as:
- kubernetes-node01
- switch1
- kubernetes-node02
- switch1
- switch2
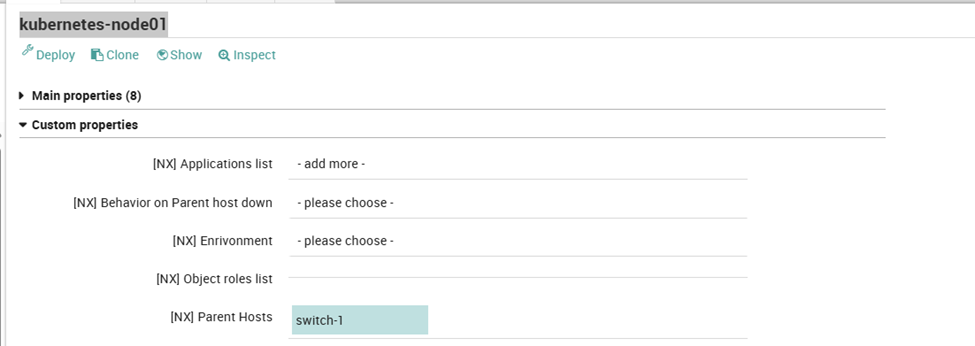
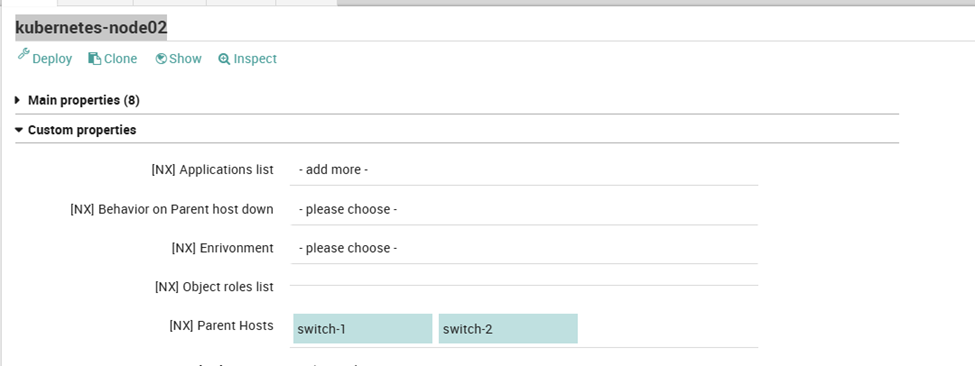
In this way, the custom_var nx_parent_hosts has been populated with the correct dependencies on the respective hosts: [“switch-1“] and [“switch-1“, “switch-2“].
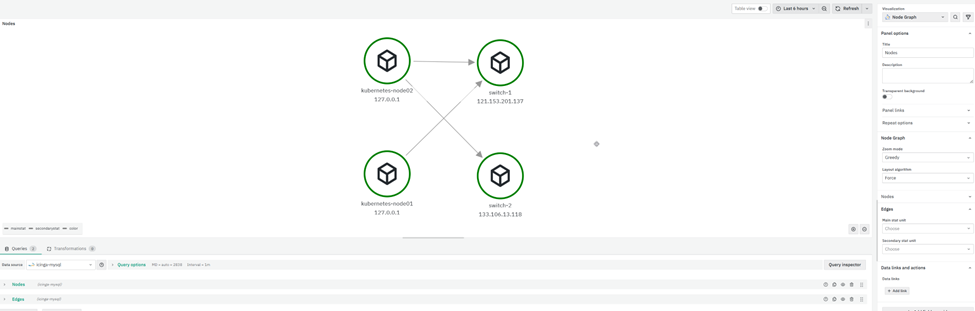
Then we use a second query that relates the tables thus providing the Edges for the chart
- icinga_customvariables
- icinga_objects
The result is a dynamic dashboard that, although simple, allows us to get an idea of the potential that this plugin can give us:
These Solutions are Engineered by Humans
Did you find this article interesting? Does it match your skill set? Our customers often present us with problems that need customized solutions. In fact, we’re currently hiring for roles just like this and others here at Würth IT Italy.


Attilio Broglio
Author
Latest posts by Attilio Broglio
10. 10. 2025
Icinga Web 2, NetEye, Unified Monitoring
Massive Clean-up of the Icinga custom_var (Services)