21. 05. 2026
APM, Kubernetes

Recently, it’s become noticeable that the use of OpenShift environments is spreading more and more, and has now firmly established itself within many companies. This naturally leads to the need to integrate these environments into monitoring in a sensible and purposeful way.
Some of my colleagues have already written blog posts in the last few years about the various options for OpenShift monitoring, which I would now like to summarize and expand upon based on our extended experience.
The NetEye monitoring solution offers both active and passive monitoring capabilities. In addition, NetEye includes further modules such as the Elastic Stack, which can be used not only as a log management solution, but also to collect performance data and enable monitoring.
All of these capabilities mean it’s easy to start monitoring an OpenShift environment.
Since OpenShift already includes built‑in monitoring for Prometheus, Grafana, and Alertmanager, it makes sense to leverage these components.
The different options for doing so are described in this blog post. One approach is to send alerts from Alertmanager to NetEye, where they are processed and stored; another is the direct integration of Grafana dashboards with the OpenShift Prometheus server.
As mentioned above, the OpenShift environment can also be integrated into Elastic. The Elastic Agent includes a Kubernetes integration that allows the OpenShift/Kubernetes environment to be easily connected to Elastic.
Regarding Elastic, I would also like to add that APM data from an OpenShift environment can of course be collected via telemetry data and displayed and analyzed in Kibana’s APM section. This makes it possible to identify and evaluate potential latencies in applications running on OpenShift.
Naturally, an OpenShift environment can also be integrated into classic active monitoring. For this, we use plugins provided by Centreon, as well as custom‑written plugins that actively retrieve the necessary information via the Kubernetes or Prometheus API. This lets us display it in the classic monitoring interface, and even trigger standard monitoring alerts.
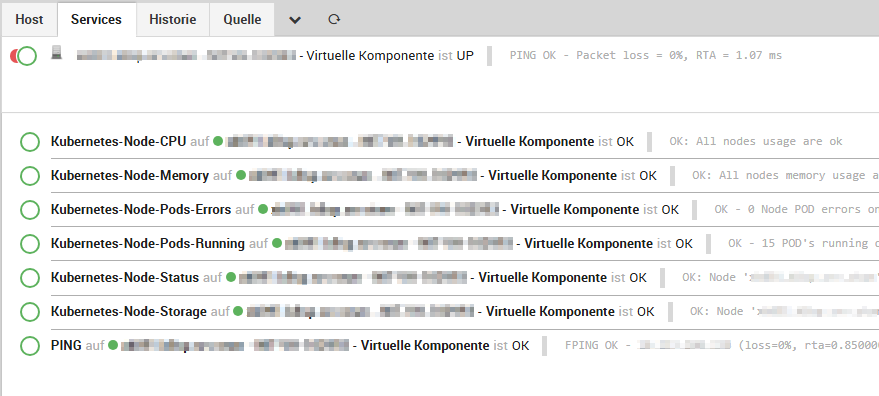
We distinguish between cluster and node monitoring objects, and the results are also displayed in Grafana, as you can see in the following images:
Cluster Monitoring:
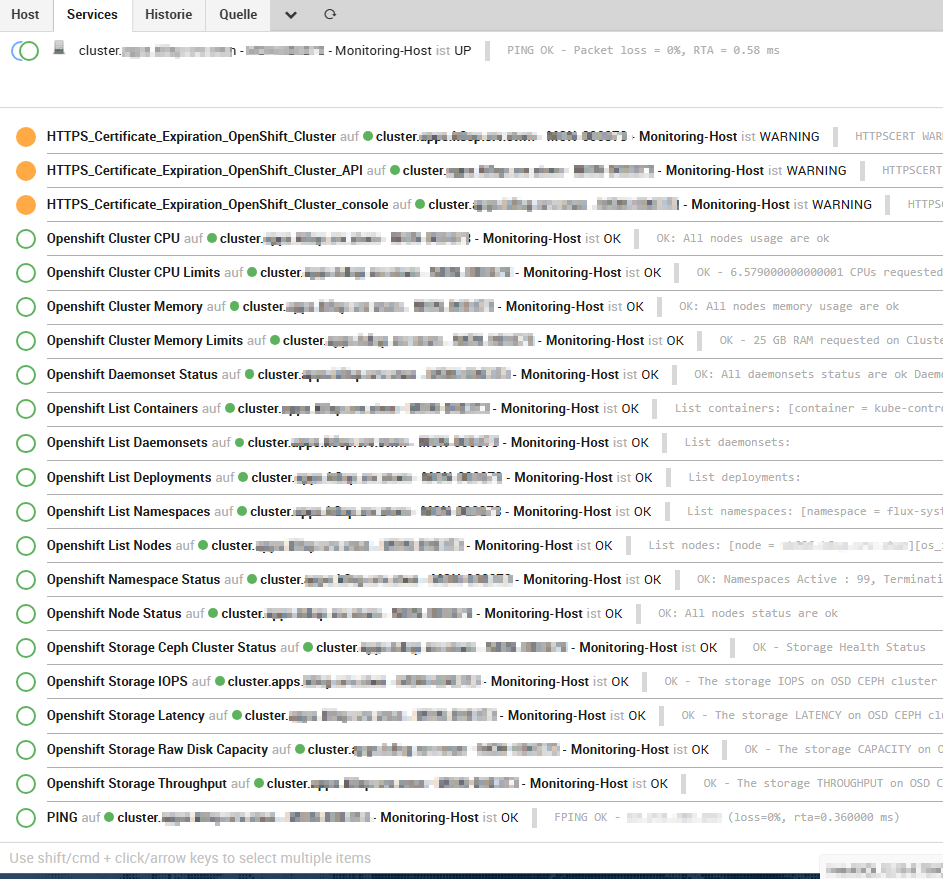
Node Monitoring:
In conclusion, NetEye is a fully comprehensive solution that allows you to monitor, measure, and analyze an OpenShift environment entirely according to your needs and requirements. Depending on the goals to be achieved, the system can be configured accordingly.

Tobias Goller
NetEye Solution Architect at Würth IT Italy
I started my professional career as a system administrator.
Over the years, my area of responsibility changed from administrative work to the architectural planning of systems.
During my activities at Würth IT Italy, the focus of my area of responsibility changed to the installation and consulting of the IT system management solution WÜRTHPHOENIX NetEye.
In the meantime, I take care of the implementation and planning of customer projects in the area of our unified monitoring solution.
Author
Latest posts by Tobias Goller
13. 10. 2025
Log-SIEM, Unified Monitoring
Elastic Defend: Experiences
18. 07. 2025
Automation, Cloud
Running SOS Berlin JobScheduler in Containers: A Step Toward Cloud-Native Scheduling
16. 04. 2025
NetEye, Unified Monitoring
Application Performance Monitoring in NetEye with Elastic APM and OpenTelemetry