
Recently we had to monitor an EKS cluster and several other resources using NetEye. AWS already provides solid dashboards out of the box, but log analysis isn’t as flexible as in Elasticsearch, and costs can easily grow out of control.
Our goals were to:
- Monitor application logs generated inside the cluster
- Monitor the cluster itself
- Monitor external resources, namely Route53 DNS, Elastic Load Balancers, and Aurora DB
AWS CloudWatch is a monitoring and observability service that collects logs, metrics, and events to provide real-time visibility into AWS resources and applications. It offers a unified view of system operations, enabling dashboards, alarms, and automated responses to issues.
However, in this specific use case, we’re only interested in its log collection capabilities, not in its analysis features.
AWS integrates quite easily with Elasticsearch through the AWS Integration. Multiple integrations are available, but most of them are just subsets of the main one, useful when you only need to monitor specific components.
What We Need
The main requirement is to set up an IAM user (we strongly recommend using a dedicated one) and attach an IAM Policy like the following:
{
    "Statement": [
        {
            "Action": [
                "s3:GetObject",
                "s3:ListBucket"
            ],
            "Effect": "Allow",
            "Resource": "*"
        },
        {
            "Action": [
                "logs:DescribeLogGroups",
                "logs:DescribeLogStreams",
                "logs:GetLogEvents",
                "logs:FilterLogEvents"
            ],
            "Effect": "Allow",
            "Resource": "*"
        },
        {
            "Action": [
                "sqs:ReceiveMessage",
                "sqs:DeleteMessage",
                "sqs:GetQueueAttributes"
            ],
            "Effect": "Allow",
            "Resource": "*"
        },
        {
            "Action": [
                "cloudwatch:GetMetricData",
                "cloudwatch:ListMetrics",
                "ec2:DescribeRegions",
                "sts:GetCallerIdentity",
                "rds:DescribeDBInstances",
                "rds:DescribeDBClusters",
                "rds:ListTagsForResource",
                "tag:GetResources"
            ],
            "Effect": "Allow",
            "Resource": "*"
        }
    ],
    "Version": "2012-10-17"
}
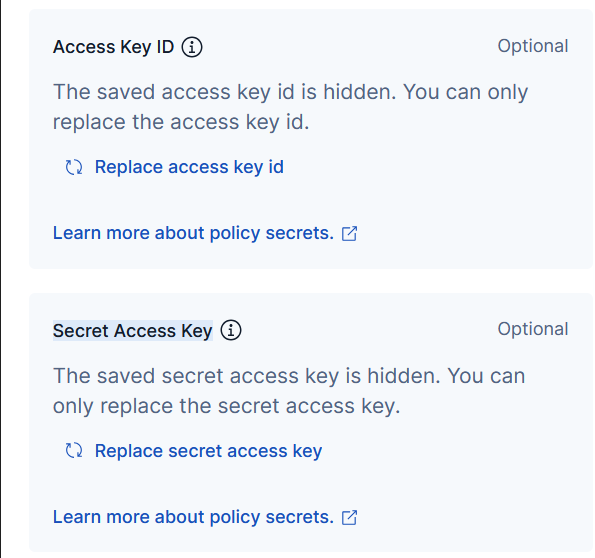
Then create an Access Key for the Third-party service use case (you will be prompted to confirm the choice).
With this setup, the user will have sufficient permissions to read all the logs required for the initial scope.
Integration Setup
Once the Access Key is generated, you will obtain the Access Key ID and Secret Access Key, which are required to configure the AWS Integration and start collecting logs.
At this point, you can configure the different components.
CloudWatch logs
The Collect logs from CloudWatch option is the most generic starting point: it simply scrapes all log groups matching the specified Log Group Name Prefix and indexes them into Elasticsearch.
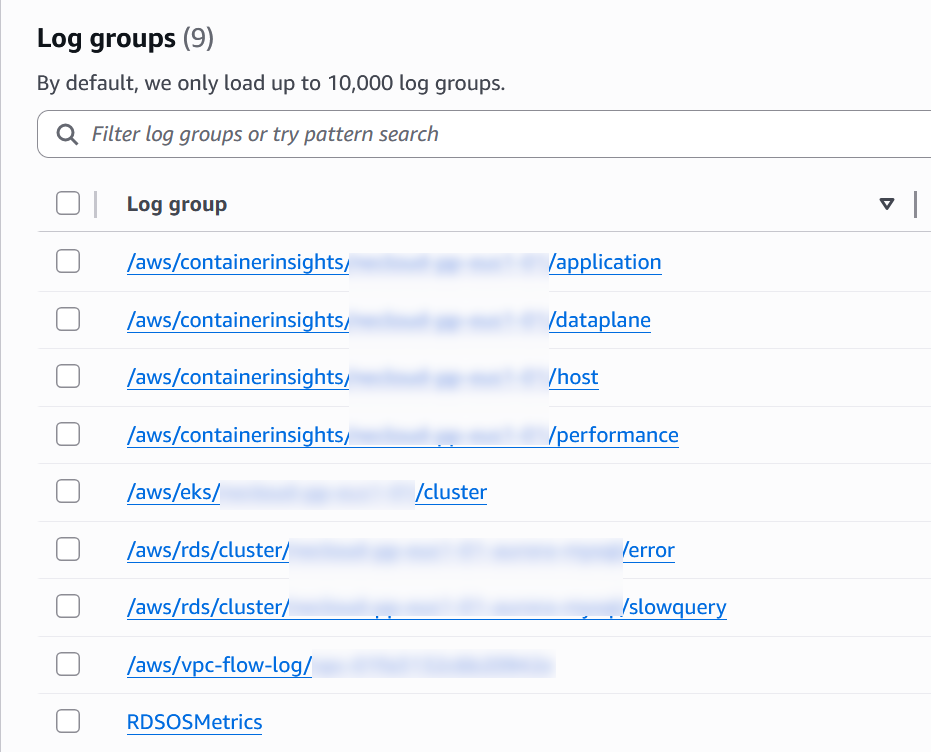
This integration performs no enrichment: logs are ingested as-is. If you need structured data or better querying capabilities, you’ll have to implement your own ingestion pipelines or processors.
One limitation of this component is that it doesn’t support multiple Log Group Name Prefix values. For example, using aws/* will collect almost everything, but if you only need EKS and RDS logs, you have to configure multiple integrations. This works reliably, but can become cumbersome to maintain.
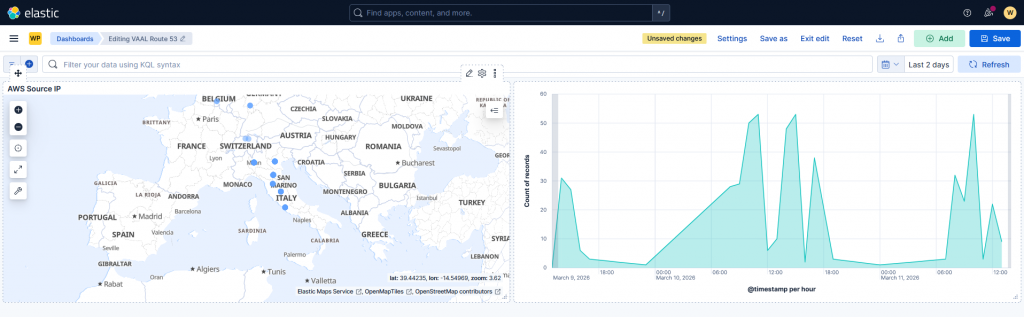
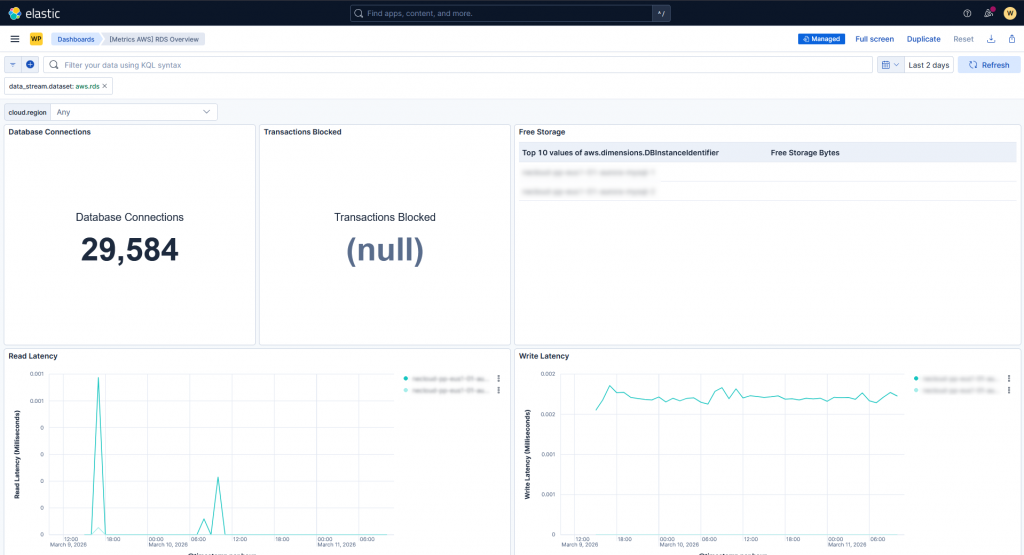
Other components, such as Route53 and Aurora RDS metrics, work quite well out of the box: logs are properly parsed and ready-to-use dashboards are provided, allowing you to quickly start working with the incoming data.
Aurora logs, however (e.g., slow query logs and error logs), are not parsed correctly. You will only see the raw message, and a custom ingestion pipeline is required to extract meaningful fields. One detail to keep in mind: for slow query logs, you need to define a DB cluster parameter group to enable the required variables.
For EKS, nothing is provided out of the box: logs are collected, but no parsing, enrichment, or dashboards are available.
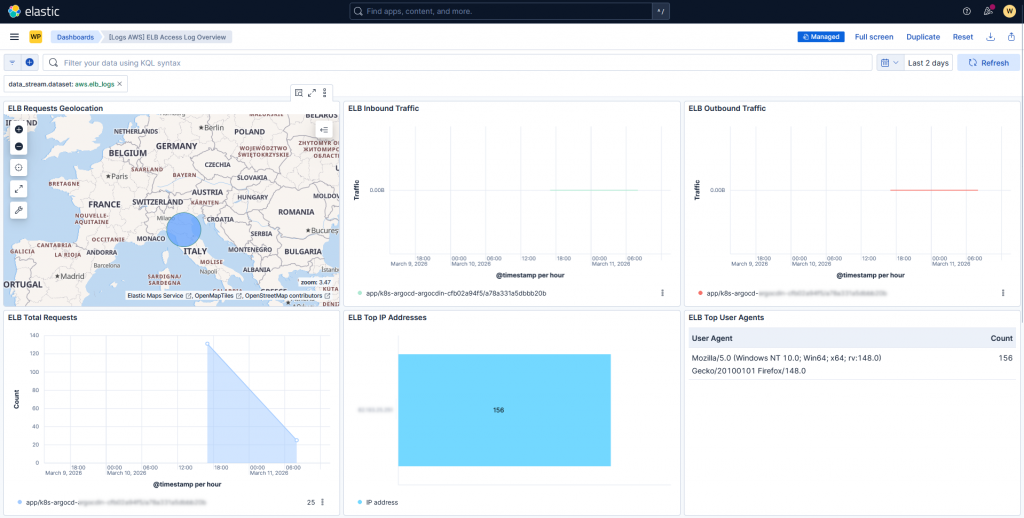
Elastic Load Balancers follow a different approach: logs are not retrieved directly from CloudWatch log groups. Instead, you need to configure the ELB to write logs to an S3 bucket with the appropriate bucket policy:
{
    Version = "2012-10-17"
    Statement = [
      {
        Effect = "Allow"
        Principal = {
          Service = "logs.amazonaws.com"
        }
        Action   = "s3:PutObject"
        Resource = "<S3_BUCKET_ARN>"
      },
      {
        Effect = "Allow"
        Principal = {
          AWS = "<AWS_PRINCIPAL>"
        }
        Action   = "s3:PutObject"
        Resource = "<S3_BUCKET_ARN>"
      }
   ]
 }
These logs are then consumed via an SQS queue, which exposes them through an API. The AWS integration polls this API and ingests the data.
{
    Version = "2012-10-17"
    Statement = [
      {
        Effect = "Allow"
        Principal = {
          Service = "s3.amazonaws.com"
        }
        Action   = "sqs:SendMessage"
        Resource = <SQS_QUEUE_ARN>
        Condition = {
          ArnLike = {
            "aws:SourceArn" = <S3_BUCKET_ARN>
          }
        }
      }
    ]
  }
As with Route53, logs and metrics are generally well ingested, and several dashboards are available, even though not all of them work out of the box.
Conclusions
From our evaluation, we can summarize the following:
- CloudWatch integration does not provide built-in dashboards or processing for EKS workloads
- OTel can be easily deployed on both cloud and on-premise environments, allowing reuse of the same monitoring stack
- CloudWatch is not free: you pay for log/metric storage and outbound data transfer, which can become expensive at scale
- External resources are well supported and can be monitored with minimal effort
- Cloudwatch collection is performed with a pull approach, making it more reliable than a push approach
In the end, we opted for a hybrid approach:
- Use edot and OTel to collect metrics, traces, and logs from inside the EKS cluster
- Use CloudWatch (or S3 + SQS) for logs and metrics from external resources
CloudWatch with short retention can still be useful as a lightweight backup monitoring layer for EKS and application in case of network issues or misconfigurations.
These Solutions are Engineered by Humans
Are you passionate about performance metrics or other modern IT challenges? Do you have the experience to drive solutions like the one above? Our customers often present us with problems that need customized solutions. In fact, we’re currently hiring for roles just like this as well as other roles here at Würth IT Italy.

Alessandro Valentini
DevOps Engineer at Würth IT Italy
Platform Engineer at Würth IT Italy
Author
Latest posts by Alessandro Valentini
30. 06. 2026
Automation, DevOps, Kubernetes, Uncategorized
K8s Secrets: Why We Migrated from SealedSecrets to ExternalSecrets
05. 08. 2025
DevOps, Kubernetes
Use S3 Storage with OpenShift Data Foundation
04. 03. 2025
Automation, DevOps, Service Management
Group-aware Reboot with Ansible
31. 12. 2024
DevOps
GitOps: Pull-based vs Push-based Approaches