29. 06. 2026
Atlassian

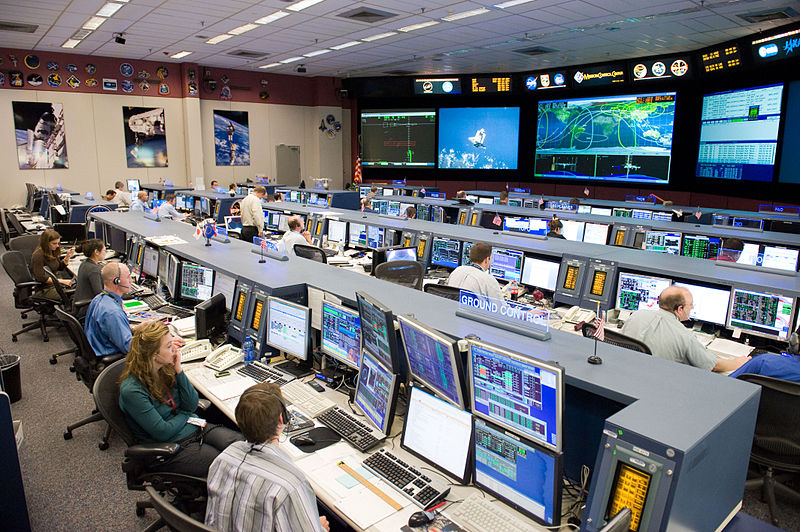
Two screens for monitoring, ticketing, event management, CRM, project management and Outlook, and at least another two screens for all the applications that you need to manage… that often seems to be the minimum for working efficiently. However, you probably don’t want your office to look like a NASA flight control room…
To organize the daily work of your team, an IT service management tool such as EriZone can provide a single dashboard that joins incident-, service- and change-management, ongoing projects and customer information, and replaces an email client for most needs. Thus on a single dashboard you can see your customers’ requests and the to-do list for your working group. So why don’t you also add the requests that arrive directly from your hardware?
A ticket for every event that arrives from your hardware? Thousands a day! …Stop!! A good monitoring and event management tool will at least do the hard work of filtering so that you only see the critical events that need your attention.
Now you basically have two possibilities to feed the remaining events to your ticketing tool:
- Automatically create a ticket for each host and/or service that is in a critical state. You will be able to focus on your ticketing system, but depending on the setup of your event management, you run the risk of having a lot of manual work to close the tickets. On the other hand, you will get exhaustive historical data for the status of your services.
- Create only acknowledged tickets. You will still have to look at the monitoring tool, where you acknowledge events that need the intervention of your team. This means that you’re aware of the issue and thus you won’t get any more notifications, but a ticket is automatically created, so your team can address the issue and fix it, and discuss and describe the solution inside the ticket.
Whichever way you feed these events into EriZone, with the SystemMonitoring plugin correlated events can be joined in a single ticket and tickets will auto-close when the host or service is up again.
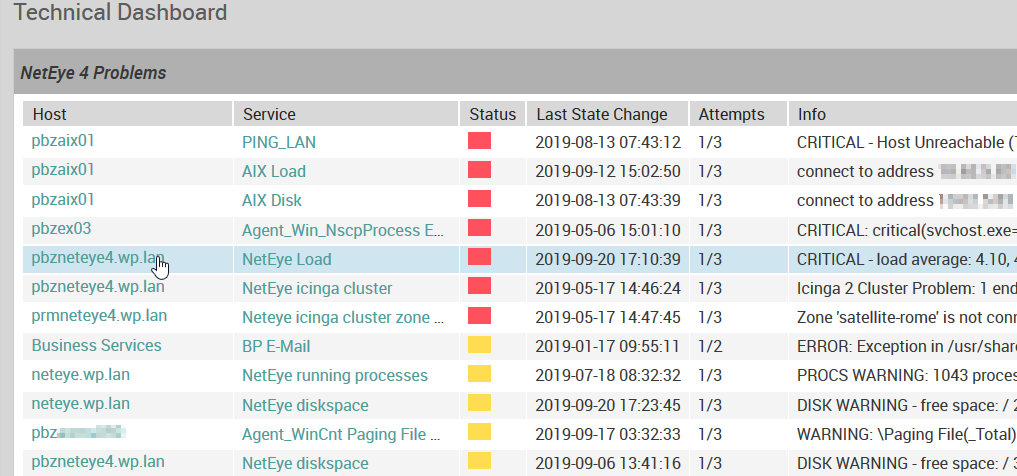
Moreover, EriZone includes a dashboard that visualizes warnings from your monitoring tool (now also compatible with NetEye4 and Icinga), so your team can access this information from anywhere. Hosts and services link to the NetEye/Icinga detail pages.
Mirko Morandini
Mirko Morandini, PhD, is a senior consultant in IT Service Management and Asset Management, with over a decade of experience and numerous successful projects in Germany, Austria and Italy. As the GLPI advocate at Würth IT Italy, Mirko is passionate about open source solutions - and when he’s not optimizing IT processes, he enjoys spending time with his family and playing and conducting wind band music.
Author
Latest posts by Mirko Morandini
31. 03. 2026
Asset Management, GLPI, Service Management
GROUP-based Asset Permissions in GLPI 11: GLPI Rights Management Redefined
29. 09. 2025
Asset Management, GLPI, Knowledge Management, Service Management
Getting the M(u)st out of GLPI
30. 06. 2025
Asset Management, Unified Monitoring
Das neue GLPI 11 – offizielle deutsche Vorstellung [DE]