
22. 09. 2016
Luca Di Stefano
NetEye, Real User Experience Monitoring
Warum erhöht sich meine Netzwerk-Latenz an Arbeitstagen?
Manchmal kommt es vor, dass Sie zu bestimmten Tageszeiten eine höhere Netzwerk Latenz erfahren als an anderen.
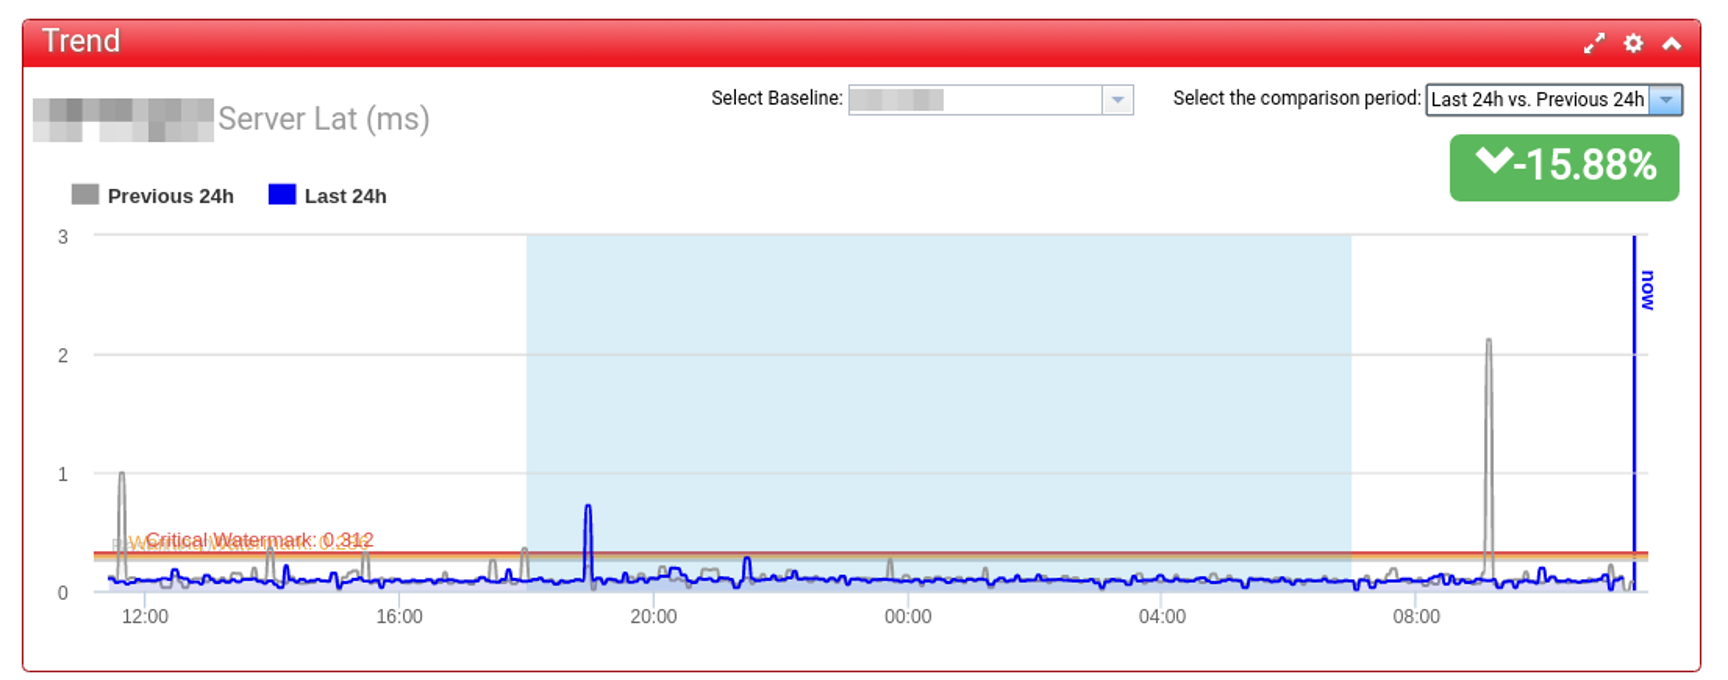
Netzwerk-Abschnitt eines Rechenzentrums (1 Gigabit Ethernet) mit normaler, konstanter Latenz während des Tages. Bitte beachten Sie, dass die typische Latenzzeit für 1 Gigabit Ethernet Verbindungen weniger als 5ms beträgt.
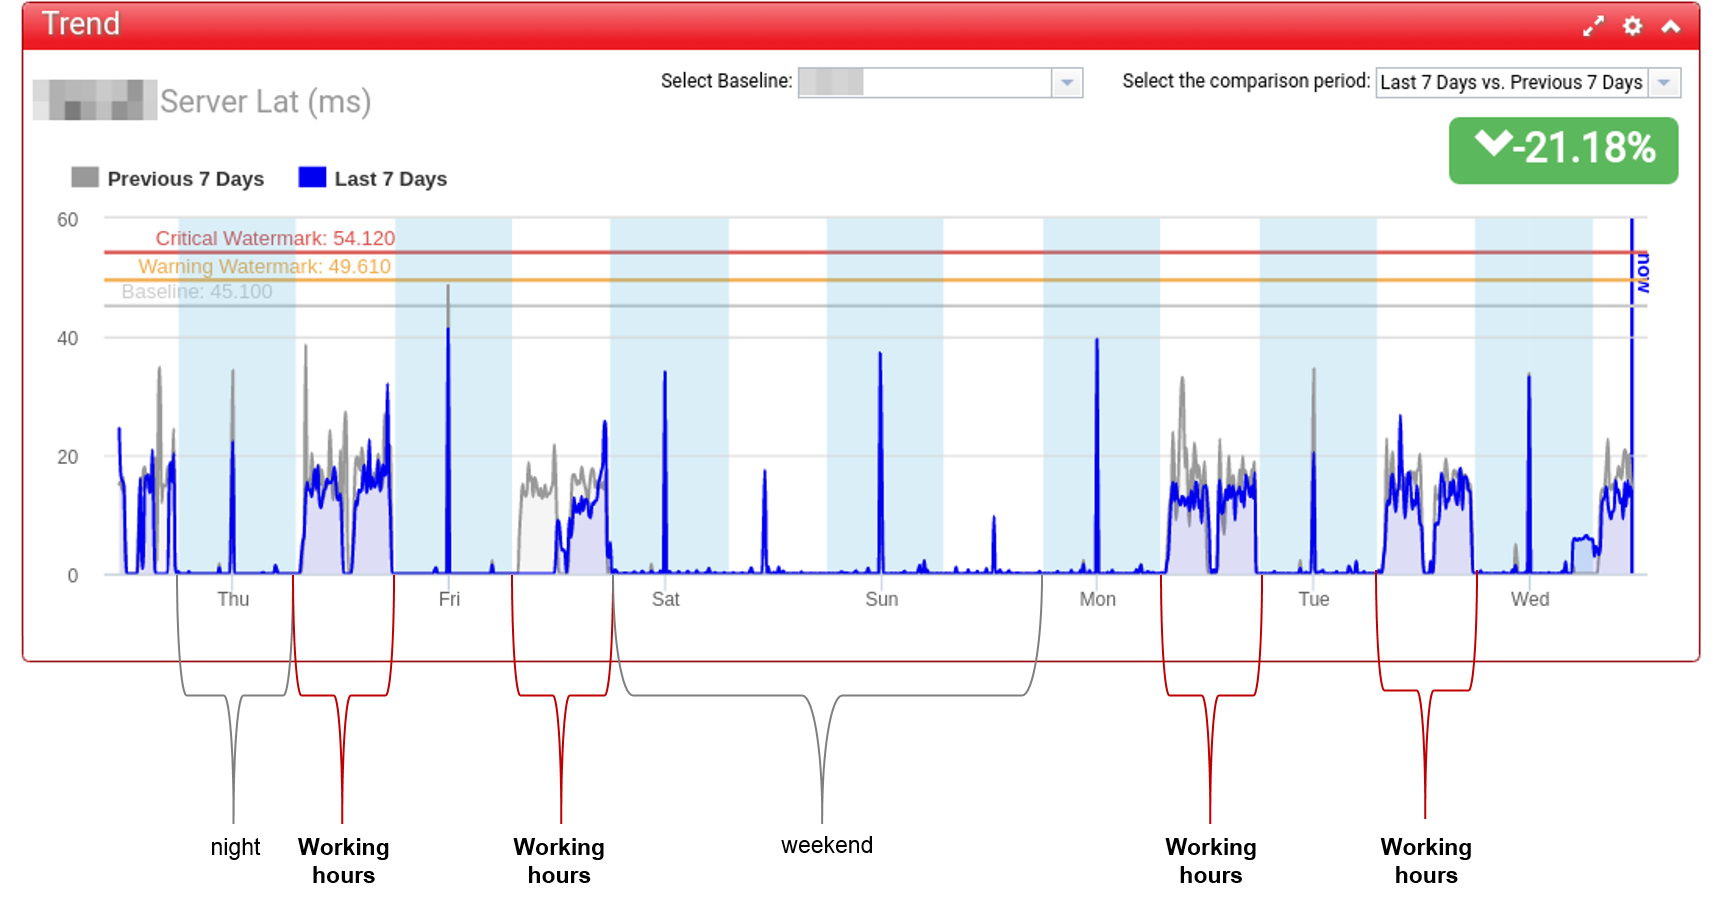
Netzwerk-Abschnitt eines Rechenzentrums (1 Gigabit Ethernet) mit erhöhter Latenz während der Arbeitszeit. Bitte beachten Sie, dass die typische Latenzzeit für 1 Gigabit Ethernet Verbindungen weniger als 5ms beträgt.
Man erkennt einen Trend zunehmender Latenz, der während der Geschäftszeiten auftritt.
Es mag trivial erscheinen, aber es ist wichtig darauf wissen, dass dieser Hinweis uns dabei helfen kann, überlastete Netzwerk-Geräte zu identifizieren.
In der Tat weisen unterschiedlich Netzwerkgeräte unter Belastung verschiedene Leistungen auf. Insbesondere Geräte, die Routing / Filterung / Tagging ausführen, reagieren empfindlich auf die Menge der Pakete, die verarbeitet werden muss.
Je größer die Operationen sind, welche das Gerät verarbeiten muss, desto langsamer werden die Verarbeitungs-Queues geleert, wodurch die Latenz steigt. Wenn die Latenz beginnt sehr empfindlich auf höhere Belastungen zu reagieren, müssen die Konfigurationen des Geräts überprüft und auf dessen Verarbeitungsgeschwindigkeit angepasst werden. Durch die Konfiguration der Überwachung bestimmter Netzwerkabschnitte in NetEye RUE, sind wir in der Lage, ein solches Verhalten hervorzuheben und entsprechend zu intervenieren.


Luca Di Stefano
Solution Architect at Würth Phoenix
Hi everyone, I’m Luca, graduated in electrical engineering from the University of Bologna. I am employed by Würth Phoenix since its foundation. I worked mainly as enterprise architect and quality assurance engineer. Previously I was involved in systems measurement and embedded systems programming. I have gained experience on Unix (Solaris, HPUX), Windows, and C, C + +, Java. I personally contribute to the Open Source community as beta tester and developer. During my spare time I love piloting airplanes fly over the beautiful Alps. I practice many sports: tennis, broomball, skiing, alpine skiing, volleyball, soccer, mountain biking, middle distance, none have a sample but the competition excites me! I love hiking, tracking and traveling.
Author
Latest posts by Luca Di Stefano
27. 04. 2017
Uncategorized
Chi si sta mangiando la banda? Scoprilo con ntopng
27. 04. 2017
Uncategorized
Identifizieren Sie Bandbreitenfresser mit ntopng
22. 09. 2016
NetEye, Predictive Analysis, Real User Experience, Unified Monitoring
Why does my local network latency increase during working hours?
22. 09. 2016
NetEye, Real User Experience Monitoring
Perchè aumenta la mia latenza di rete durante i giorni lavorativi?