


02. 04. 2026
NetEye, Unified Monitoring


Als Monitoring-Consultant stehe ich immer wieder vor der Aufgabe die Überwachung eines Nutanix Systems in NetEye zu integrieren. Nutanix ist ein Integrated Systems Vendor der hyperconvergente Storage-Systeme produziert, das entsprechende Produkt nennt sich „Nutanix Virtual Computing Platform“.
An sich ist es ganz einfach die Nutanix Systeme zu überwachen. Mit NetEye können Sie in diesem Bereich sehr gute Ergebnisse erzielen und haben zusätzlich verschiedene Darstellungsmöglichkeiten.
Die Überwachung erfolgt über das SNMP Protokoll:
Zuerst müssen Sie das SNMP Protokoll auf Nutanix-Seite freischalten. Dann können Sie das Plugin check_nutanix.pl (zu finden auf der Nagios Exchange Webseite) auf NetEye installieren und los geht’s. Damit können Sie nun Cluster-Lops, Cluster-Latenzen usw. aktiv monitoren. Wichtig: Damit das Plugin funktioniert müssen Sie die Nutanix MIBs ins NetEye laden.
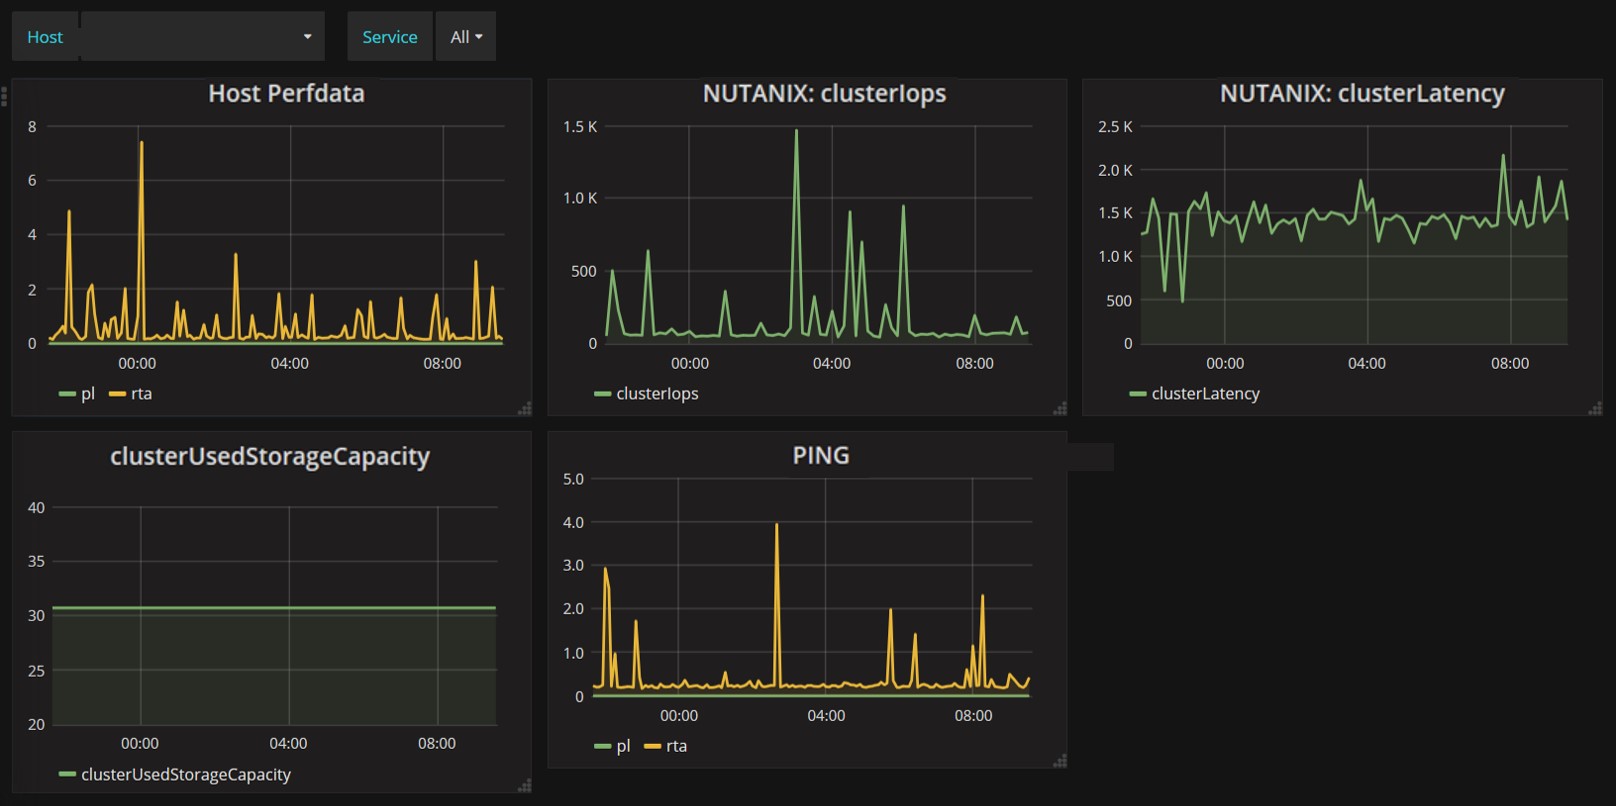
Die erfassten Performance-Daten werden dann in NetEye direkt in eine InfluxDB Datenbank geladen, damit Sie anschließend auf einem Grafana-Dashboard dargestellt werden können.
Zusätzlich können Sie auf dem Nutanix System das SNMP Trap Alerting aktivieren. Dafür konfigurieren Sie den NetEye Server als Destinations-Host. Anschließend müssen Sie noch den NetEye Eventhandler so konfigurieren, dass er die SNMP Trap Events von Nutanix sammelt die den Status eines passiven NetEye Checks ändern.
Durch diese Art der Benachrichtigungen können Sie spezielle Events überwachen die nicht aktiv gemonitort werden.
In der folgenden Abbildung sehen Sie mögliche aktive und passive Checks:
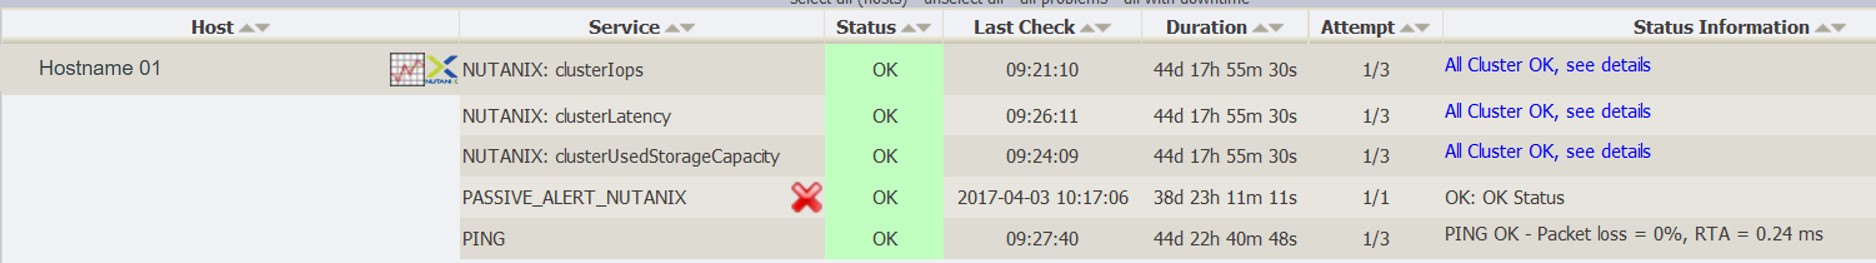
Wie Sie sehen, können Sie mit NetEye sowohl aktives als auch passives Monitoring betreiben und bekommen dank der Integration von Grafana und Influx eine zeitnahe Sicht auf alle Leistungsdaten.

Tobias Goller
NetEye Solution Architect at Würth IT Italy
I started my professional career as a system administrator.
Over the years, my area of responsibility changed from administrative work to the architectural planning of systems.
During my activities at Würth IT Italy, the focus of my area of responsibility changed to the installation and consulting of the IT system management solution WÜRTHPHOENIX NetEye.
In the meantime, I take care of the implementation and planning of customer projects in the area of our unified monitoring solution.
Author
Latest posts by Tobias Goller
16. 02. 2026
Unified Monitoring
OpenShift Monitoring in NetEye
13. 10. 2025
Log-SIEM, Unified Monitoring
Elastic Defend: Experiences
18. 07. 2025
Automation, Cloud
Running SOS Berlin JobScheduler in Containers: A Step Toward Cloud-Native Scheduling
16. 04. 2025
NetEye, Unified Monitoring
Application Performance Monitoring in NetEye with Elastic APM and OpenTelemetry